Foot traffic attribution is the practice of connecting an ad exposure, whether from a billboard, a mobile ID, or a digital out-of-home screen, to a measurable visit at a physical location, using a control group to separate real lift from normal traffic patterns. It works when you have enough exposed and unexposed visitors to compare, a defined visit standard, and a campaign duration long enough to produce statistically stable results. For a single-location pop-up running for three days, skip it. For a multi-location retail or QSR campaign, it’s often the only way to prove media spend actually pulled people through the door.
Three numbers matter more than the rest:
- Visit rate: the percentage of your exposed audience that showed up at a tracked location.
- Incremental visits: visits directly attributable to the campaign, isolated from the control group’s baseline behavior.
- Cost per incremental visit (CPIV): total spend divided by incremental visits, which Factori for comparing media channels on equal footing.
Get these three right and you can defend a media budget in a room full of skeptical CFOs. Get them wrong, and you’re reporting a number that looks impressive but means nothing.
TL;DR:
- Accurate foot traffic attribution requires a well-defined visit standard, a genuine control group, and multiple attribution windows tailored to purchase cycles.
- Metrics like visit rate, incremental visits, and cost per incremental visit are essential for credible measurement and comparison across media channels.
- Validation methods such as shuffled-exposure and placebo cohort tests help ensure lift numbers reflect true campaign impact, not statistical artifacts.
- Different business types need tailored attribution windows: same-day for quick impulsive buys and longer decayed windows for considered purchases like furniture.
- Effective attribution strategies build measurement into all campaign stages, combining route verification, QR codes, and multi-signal data for defensible results.
Table of Contents
- What foot traffic attribution measures and the terms you’ll see in every report
- How foot traffic attribution works: exposure, detection, and control
- Why foot traffic attribution matters for budget and creative decisions
- Best practices for running a defensible attribution program
- How attribution windows and results differ by business type
- How Beacon Mobile Media builds attribution into every campaign
- What actually earns the attribution investment
- Start measuring what your OOH campaigns actually deliver
- Key Takeaways
- Sources
What foot traffic attribution measures and the terms you’ll see in every report
Every vendor report leans on the same handful of terms, and knowing them cold is the difference between reading a report critically and just nodding along.
Visitation rate is simple: what share of people exposed to your ad actually visited a location within your attribution window. Lift compares that rate against a control group, people who match your exposed audience demographically and geographically but never saw the ad. Incremental visits convert that lift percentage into an actual headcount, and CPIV turns the headcount into a dollar figure you can put next to your cost-per-click from paid search.
None of this works without a real control group. A statistically matched set of unexposed users isolates the campaign’s effect from seasonal shifts, local events, and competing media running at the same time. Skip the control group and compare last month’s foot traffic to this month’s, and you have a correlation, not proof that the ad caused anything.
“Visit” needs a precise definition too, or the whole exercise falls apart. Most rigorous methodologies use polygon mapping (a GPS-drawn boundary around the physical store, not just a lat/long point) combined with a dwell-time threshold, often 2 to 5 minutes, to filter out people who simply drove past or walked along an adjacent sidewalk.
Attribution windows vary by purchase behavior:
- Same-day: captures immediate, low-consideration responses, common for QSR and convenience retail.
- 7-day: the middle ground, often the default for general retail and services.
- 30-day decayed: weights early visits more heavily than late ones, suited to considered purchases.
Strategus notes that short windows fit low-consideration buys like fast food, while longer or decayed windows are necessary for furniture, automotive, or anything with a longer decision cycle. Choosing the wrong window either overstates impact (crediting a visit that would have happened anyway) or understates it (cutting off measurement before the customer actually acts).
How foot traffic attribution works: exposure, detection, and control
The mechanics break into three stages, and understanding each one tells you where a vendor’s methodology might be cutting corners.
1. Exposure identification. This is where you determine who actually saw the ad. For mobile-based campaigns, that means matching mobile advertising IDs to users who were physically near a DOOH screen or within a geofenced radius of a billboard route. CTV and household-level campaigns rely on modeled exposure rather than a direct signal, since there’s no device ID tied to someone watching a connected TV ad. Panel methods sample a smaller, verified group and project outward. Each approach trades off precision for scale differently, and no single method covers every media type equally well.

2. Visit detection. Once exposure is established, the system watches for a subsequent visit inside a defined polygon around a physical location. The strongest setups combine multiple signals rather than relying on GPS alone: Wi-Fi and Bluetooth proximity data catch visits GPS might miss indoors, and hardware sensors at the door add a layer of ground truth. Ariadne’s research points to door-level hourly counts with accuracy in the high 90s, paired with a documented method for handling group entries and re-entries, as the resolution needed for regression-based lift analysis that actually holds up. POS or CRM linkage adds a final layer, tying a visit to an actual transaction rather than just a location ping.

3. Control and experiment design. This is where most attribution reports either earn credibility or lose it. A geographic holdout, running the campaign in some markets and withholding it in comparable ones, gives you a clean natural experiment. Audience-level splits work similarly within a single market. Perion describes the three-step requirement for defensible DOOH attribution: identify exposure, track visits, and establish a matched control baseline before you claim any lift number means anything.
Modeling choices matter here too. Deterministic approaches rely on hard device-level matches; modeled or hybrid approaches fill gaps with statistical projection when identifiers are missing or degraded. Covariates, weather, local events, a competitor’s grand opening the same week, need to be built into the model, because a heat wave or a street fair can produce a “lift” that has nothing to do with your ad.
Pro Tip: Ask any measurement partner for two validation checks before you trust their lift number: a shuffled-exposure test, which should return near-zero lift, and a placebo cohort in a store category you didn’t target, which should show no lift either. If both pass, the headline number is far more likely to be real.
Why foot traffic attribution matters for budget and creative decisions
The real value of foot traffic attribution isn’t the report itself, it’s what the report lets you decide. Once you have CPIV, you can put out-of-home, DOOH, and CTV on the same comparison sheet as paid search and social, using dollars per outcome instead of dollars per click. That’s a genuinely different conversation with a finance team.
Practical decisions this unlocks:
- Reallocating spend toward the placements, routes, or dayparts producing the lowest CPIV.
- Testing creative variants against each other using visit lift rather than guesswork.
- Narrowing audience targets when one demographic segment consistently shows higher visitation rates.
- Justifying a channel shift from clicks-driven digital toward physical-world media when foot traffic proves a higher-intent signal than a click ever was.
There’s a real limit here worth stating plainly: a store visit is not a sale. Someone can walk in, browse, and leave empty-handed, and your attribution report will still count it as a win. That’s why the strongest programs pair visit data with POS or loyalty program records, turning “did they show up” into “did they buy, and how much.” Read more on connecting media performance to measurable OOH strategy outcomes if you’re building this bridge for the first time.
Best practices for running a defensible attribution program
A foot traffic number that can’t survive a skeptical question from your CFO isn’t worth reporting. Here’s how to build one that can.
-
Define the visit precisely before the campaign starts. Use polygon mapping instead of a single point coordinate, set a dwell-time threshold (commonly 2 to 5 minutes), and explicitly exclude staff devices and delivery drivers from the exposed and control pools. A visit definition decided after the data comes in is a visit definition you can bend to fit the story you want.
-
Require a real control group, every time. No exceptions for “the budget was too small” or “we didn’t have time.” A single-location before-and-after comparison is not attribution, it’s a coincidence with a chart attached.
-
Run multiple attribution windows in parallel. Same-day, 7-day, and 30-day decayed windows tell you different things, and comparing all three catches a result that only looks good under one specific cutoff.
-
Demand transparency on panel size and confidence intervals. A vendor claiming 12% lift off a panel of 400 devices is telling you something very different than 12% lift off 40,000. Ask for the confidence interval and, where the vendor calculates it, the p-value. If they can’t produce either, treat the headline number as marketing copy, not evidence.
-
Build in sensitivity checks on covariates. Weather, local events, and overlapping media flights all distort raw lift numbers. Covariate control is essential for a defensible estimate, and models that skip it tend to overstate impact.
-
Layer POS or CRM data on top of visit counts whenever you can. Visits tell you interest; transactions tell you revenue. The gap between the two is often where the real ROI story lives.
-
Plan for a cookieless measurement future now, not later. Mobile identifiers are becoming less reliable across the industry, and hybrid approaches that combine deterministic signals with modeled, panel-calibrated projections are becoming the standard rather than the exception.
Pro Tip: Before you sign off on any vendor’s attribution report, ask specifically how they validate against false positives. If the answer is vague, that’s your signal to push for the shuffled-exposure and placebo-cohort checks yourself.
How attribution windows and results differ by business type
The right window and the right benchmark change dramatically depending on what you’re selling, and vendor case studies rarely make that distinction clear enough.
A quick-service restaurant running a lunchtime billboard campaign wants a same-day or 0 to 48 hour window. The purchase decision is impulsive, so a 30-day window would dilute genuine lift with noise from people who would have eaten there anyway. CPIV benchmarks stay tight here because the sales cycle is short and the visit-to-purchase link is nearly immediate.
Apparel and general retail need more runway. A 7-day window catches most of the response, but a 30-day decayed window often reveals a longer tail, especially around payday cycles or seasonal promotions. Pairing footfall data with POS trend lines matters more here, since browsing behavior in apparel doesn’t convert at the same rate as it does in food service.
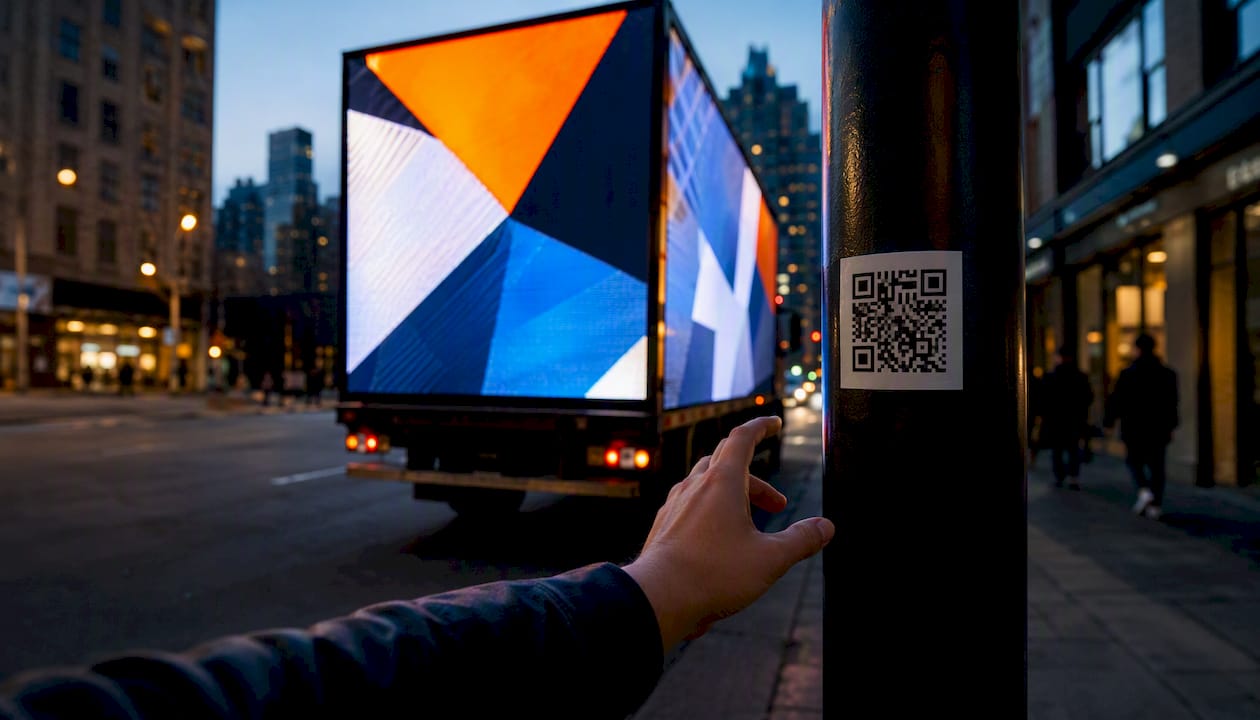
Events and venues typically lean on route-based OOH combined with QR codes for a direct-response layer that supplements visit tracking. A wrapped rideshare vehicle circulating near a conference center, paired with a scannable code, gives you both the location signal and a hard conversion data point, someone actually engaged. Read more about maximizing ROI benchmarks across OOH formats when comparing venue campaigns against other channel types.

One caveat across every vertical: audited results tend to be far more modest than headline vendor claims. A well-executed retail campaign typically produces low single-digit lift over a seven-day window, and audited lift above 10% across a national footprint is uncommon. If a case study leads with a 25% or 40% lift figure, ask how it was measured and whether it survived a placebo test.
How Beacon Mobile Media builds attribution into every campaign
Measurement only works when it’s built into the media plan from day one, not bolted on afterward as an excuse for a slow quarter. Beacon Mobile Media runs LED mobile billboards and wrapped rideshare vehicles across all 50 states with attribution as a core part of the offering, not an add-on.
That includes:
- Route customization built around exposure zones you actually want to measure against.
- Geofencing and real-time retargeting that connect an ad exposure to a follow-up digital touchpoint.
- Smart QR codes that capture direct-response data at the moment of engagement.
- Proof-of-posting documentation, GPS and photo verified, so exposure claims aren’t just self-reported.
- Attribution analytics and funnel reporting that tie exposure, visit, and engagement together.
The multi-signal approach matters because no single data source tells the whole story on its own. Combining route-level proof-of-posting with QR engagement data and geofenced retargeting gives a fuller picture than any one signal alone, closer to the multi-signal validation approach that produces defensible CPIV numbers rather than marketing estimates.
A campaign report that only shows impressions is a guess dressed up as data. A campaign report that shows proof-of-posting, QR engagement, and geofenced follow-up is something you can defend in a budget meeting.
What actually earns the attribution investment
Foot traffic attribution earns its cost when you’re running multi-location campaigns with enough volume to produce a stable control comparison, not for a single storefront testing a two-week flight. Stage it: start with QR-driven direct response because it’s cheap and fast, layer in mobile or geo panel data once you’ve validated the concept, then integrate POS data when the budget justifies the rigor.
Treat lift as directional evidence for reallocating budget, never as an absolute truth. A 3% lift over a 7-day window with a tight confidence interval tells you more than a vendor’s unaudited 20% claim. The number’s job is to move your next dollar, not to win an argument.
— Scott
Start measuring what your OOH campaigns actually deliver
There are other ways to piece together footfall measurement: standalone geofencing vendors, generic sensor providers, DIY POS matching. Most of them hand you raw location data and leave you to build the attribution model yourself. Beacon Mobile Media is different because measurement isn’t an afterthought bolted onto a billboard buy. It’s built into the campaign from route planning through proof-of-posting to final attribution reporting.

That means you get route customization designed around measurable exposure zones, smart QR codes that capture engagement at the point of contact, GPS-verified proof-of-posting, and attribution analytics that tie exposure to visits without you having to stitch together three different vendor dashboards yourself. If you’re planning your first measured campaign, start by reviewing the types of out-of-home advertising available and request a proposal scoped around the metrics that matter for your specific vertical.
Pro Tip: Start a pilot small: one route, one QR code, one 7-day window. Validate the mechanics before scaling to a multi-market campaign with a full control group design.
Key Takeaways
Defensible foot traffic attribution depends on a precise visit definition, a real control group, multiple attribution windows, and transparent reporting on panel size and confidence intervals.
| Point | Details |
|---|---|
| Track the three core metrics | Visit rate, incremental visits, and cost per incremental visit (CPIV) let you compare OOH against digital channels directly. |
| Insist on a control group | Without a matched, unexposed comparison group, a lift number is correlation, not proof of causation. |
| Match the window to purchase behavior | Use same-day for QSR, 7-day for general retail, and 30-day decayed for considered purchases like furniture. |
| Expect modest, audited lift | Well-run campaigns typically show low single-digit lift over seven days; double-digit vendor claims deserve scrutiny. |
| Beacon Mobile Media builds it in | Route customization, geofencing, smart QR codes, and proof-of-posting combine into attribution analytics from day one. |
Sources
- Factori
- Billboard footfall attribution — Ariadne
- Can you really measure footfall from DOOH ads? — Perion