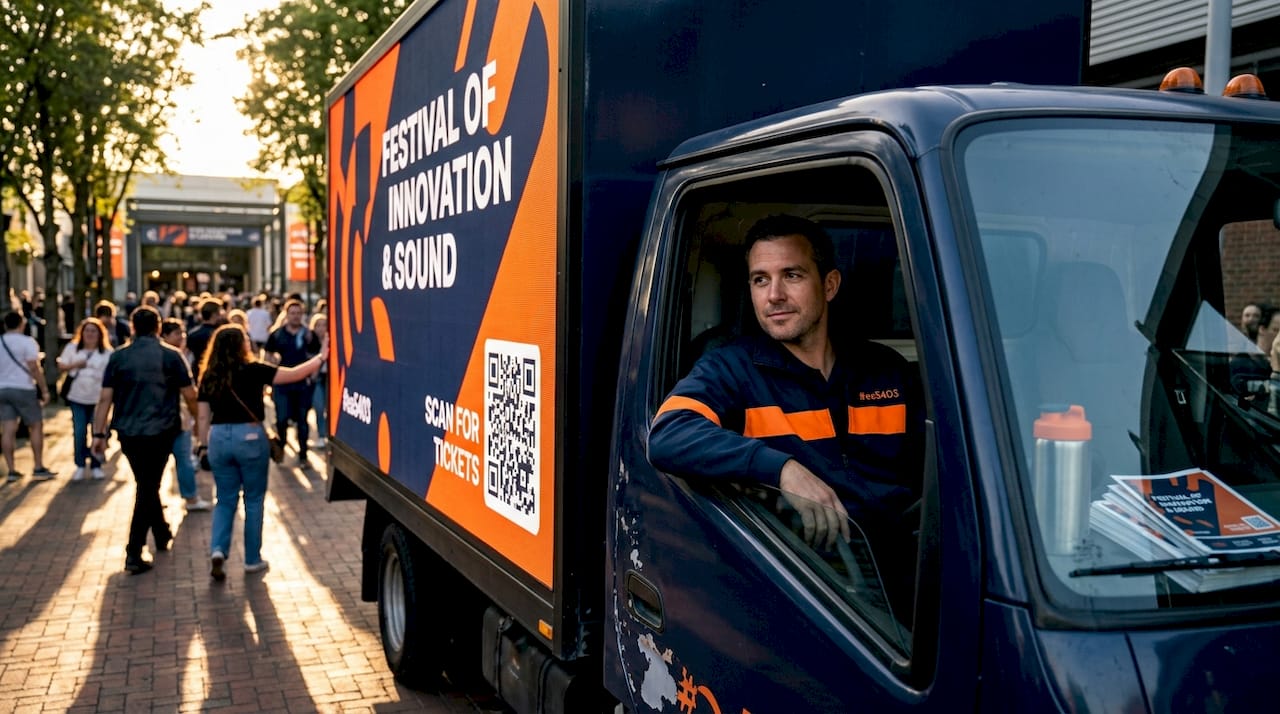
QR code tracking works by routing every scan through a dynamic QR code that redirects via a short link, logging the timestamp, device, location, and UTM data before sending the user to the destination. Static QR codes skip that step entirely, so they can’t be measured at all. The takeaway for marketers: always generate dynamic codes, tag the destination URL with UTM parameters, and use the scan data to compare placements, optimize creative, and prove attribution.
TL;DR:
- Use dynamic QR codes with UTM parameters to accurately track scan location, device, and attribution data; static codes cannot be measured or modified after printing.
- Compare metrics such as total and unique scans, placement performance, and time trends, focusing on relative signals rather than absolute numbers for better decision-making.
- Ensure proper setup: generate the code in dynamic mode, tag the destination URL with UTM parameters, test the full chain, and maintain a standardized export schema for reliable analysis.
- Avoid sharing one code across multiple placements; assign unique codes for each to enable precise comparison and avoid data blending.
- Monitor scan data in real-time during campaigns to quickly identify and fix issues, with special regard to campaign start, UTM correctness, and unexpected spikes or drops.
Table of Contents
- How QR Code Tracking Actually Works
- Which Metrics Actually Move QR Campaign Decisions?
- How Do You Set Up a Trackable QR Code Correctly?
- Getting Scan Data Into GA4, CSV, and Your BI Stack
- What Mistakes Undermine Reliable QR Scan Data?
- Smart QR Codes in Out-of-Home Campaigns: A Real-World Example
- What I’ve Learned Watching QR Campaigns Live or Die on Data
- Sources
How QR Code Tracking Actually Works
The mechanism is simpler than most marketers assume, but it explains everything about what you can and can’t measure. A dynamic QR code doesn’t encode your destination URL directly. It encodes a short link that points to a redirect server. When someone scans it, that server logs the event, then forwards the person to wherever you’ve set the code to point. A static QR code skips this step entirely, embedding the final URL in the image itself, which is exactly why it can’t be tracked, changed, or measured after printing.
That redirect is the entire trick behind dynamic QR code tracking: it’s the one moment where data can be captured before the user moves on.
Here’s what typically gets recorded during that split-second redirect:
- Timestamp of the scan, down to the minute
- Approximate city and country, based on IP geolocation
- Device type, operating system, and browser
- Referrer data, if the scan happened through an app or embedded browser
- Full UTM parameter set, if you’ve attached one to the destination URL
None of this is exact science. Geolocation from IP addresses gets you a city, not a street address. And unique scan counts rely on cookies or device fingerprints, which means someone who scans on their phone and again on a tablet might get counted twice. Most platforms also filter out bot and preview-tool traffic, since link scanners and messaging apps often “click” a URL automatically without a human ever seeing it.
Which Metrics Actually Move QR Campaign Decisions?
Raw scan counts feel satisfying, but they rarely tell you what to do next. The metrics that actually drive decisions are the ones you can compare against each other.
Start with these:
- Total scans and unique scans, tracked separately
- Scans by placement (which poster, which vehicle wrap, which flyer)
- Hourly and daily scan trends
- Device and OS splits
- Geographic distribution by city
- Referrer and UTM attribution
Each one answers a different question. A low mobile-to-desktop ratio might mean your landing page isn’t optimized for the phone camera it was scanned with. A placement generating a fraction of the scans of its neighbors tells you to reallocate print budget somewhere else. A spike in scans between 5 and 7 p.m. tells you exactly when your audience is walking past the code, which shapes when you refresh creative.
Pro Tip: Treat scan counts as relative signals, not absolute truth. Comparing one placement against another is far more reliable than chasing a fixed scan target, since bot filtering and geolocation approximation add noise to any single number.
If you’re exporting to a BI tool, keep these fields in every row: code ID, placement label, timestamp, city, device, and the full UTM set. That schema lets you slice performance by campaign, location, or creative variant without rebuilding your dashboard from scratch. It’s also the same structure most platforms already export in CSV form, so you’re not reinventing anything.
How Do You Set Up a Trackable QR Code Correctly?
Getting this right before you print anything saves you from a campaign you can’t measure. Follow this order:
- Create the code in dynamic mode. Choose a platform that generates a short link and redirect, not a static image with the URL baked in.
- Add UTM parameters to the destination URL first. Set
utm_source,utm_medium, andutm_campaignbefore you encode anything, so the tagging carries through the redirect automatically. - Assign one unique code per physical placement. A bus wrap, a storefront decal, and a flyer stack should each get their own code, following a naming convention like
campaign_placement_location. - Test the full chain before mass printing. Scan the code yourself, confirm the redirect lands correctly, and check that GA4 shows the session with the right campaign attribution rather than filing it as direct traffic.
- Plan your export and retention strategy up front. Decide whether you’ll pull data via CSV or API, and how often, so history doesn’t vanish if you downgrade plans later.
Pro Tip: Run the test scan from a phone on cellular data, not office Wi-Fi. Corporate networks sometimes strip referrer data or reroute through a proxy, which can make your test look broken when the real-world version works fine.
Getting Scan Data Into GA4, CSV, and Your BI Stack
UTM parameters are the bridge between your QR platform and Google Analytics. When they’re set correctly on the destination URL, GA4 recognizes the session as part of a specific campaign instead of lumping it into direct traffic, which is the single most common reason marketers underreport QR performance. If your QR sessions show up as direct, check the destination URL first. It’s almost always a missing or malformed UTM string, not a GA4 configuration problem.
For anything beyond a single campaign, you’ll want a repeatable export process. A CSV export works fine for occasional pulls into a spreadsheet or one-off report, but if you’re running QR codes across dozens of placements on a rolling basis, an API connection into your warehouse or BI tool saves you from manual exports every week.
Either way, standardize your schema before data starts flowing:
- Code ID and placement label
- Timestamp and city
- Device and browser
utm_source,utm_medium,utm_campaign
That structure makes it trivial to join scan data with conversion data later, whether you’re pulling into Looker Studio, a warehouse table, or a shared reporting dashboard.
What Mistakes Undermine Reliable QR Scan Data?
A few operational habits separate clean data from a mess you can’t trust. First, don’t put a dynamic, redirect-based code on anything safety-critical, like an emergency contact or a link that absolutely cannot fail. Tracked codes depend on your provider’s uptime, so a static fallback makes sense for those specific cases, even though you lose the analytics.
Second, export your scan history before a plan downgrade or before a retention window closes. Many platforms cap free-tier history at 30 days, and once it’s gone, it’s gone.
Third, expect noise in your data. Bot traffic, link preview crawlers, and messaging apps that pre-fetch URLs all generate scans that never involved a human. Validate any unusual spike against a real-world event, like a media placement going live, before you act on it.
- Reserve static codes for safety-critical or permanent links
- Export CSV history on a schedule, not as an afterthought
- Cross-check spikes against known campaign events before reacting
- Assign one code per placement, never one code shared across several
Pro Tip: If two placements share a single code, you lose the ability to compare them entirely. Unique codes per placement turn scan data into an actual A/B test instead of a single blended number.
Smart QR Codes in Out-of-Home Campaigns: A Real-World Example
Out-of-home advertising raises the stakes on QR tracking because you can’t retag a billboard after it’s printed. Beacon-ads builds smart QR codes into route-based mobile billboard and rideshare wrap campaigns, pairing each physical placement with geofencing so scan data ties back to a specific truck route, neighborhood, or event window.
The reporting typically includes:
- Proof-of-posting documentation tied to GPS and timestamp
- Scan-level data by city and time of day
- Device splits to see how mobile audiences engage after seeing a moving vehicle
- Attribution data feeding into broader retargeting and funnel reporting
For a campaign running LED trucks across multiple metro routes, that placement-level granularity is what separates a vague impression count from a report you can actually act on. You can find more detail on how this applies to fleet placements in the vehicle QR code tracking approach Beacon-ads uses across wrapped rideshare vehicles.
What I’ve Learned Watching QR Campaigns Live or Die on Data
The campaigns that pivot fastest win, and pivoting fast requires watching scan data in the first hour, not the first week. Real-time scan monitoring exists precisely because teams need to catch a dead placement or a broken redirect while there’s still time to fix it, not after the print run is spent. QR tracking isn’t complicated technology, but it’s unforgiving of sloppy setup. Get the UTMs wrong on day one and you’ll spend the whole campaign arguing about numbers instead of improving them.
Before you go live, run through this:
- Test the code and confirm the redirect resolves correctly
- Confirm the session shows up in GA4 with proper campaign attribution
- Watch first-hour scan volume against your expected baseline
- Export a data snapshot at the 24-hour mark
- Set alert thresholds for unusual spikes or dead placements
— Scott
If you’re planning a mobile out-of-home campaign and want scan data that ties directly to specific routes and placements, Beacon-ads builds attribution reporting into every LED truck and rideshare wrap deployment. Our out-of-home advertising guide walks through how QR tracking, geofencing, and route customization work together to turn a physical placement into measurable campaign data you can defend in a budget meeting.
Sources
- QR Code Analytics — Scan Tracking, Attribution & CSV Export | EZQR
- Google Analytics Help — Campaigns and campaign parameters (GA4)
- Free Dynamic QR Code Generator, Track Every Scan in Real Time | TrackableQR
- Uqr