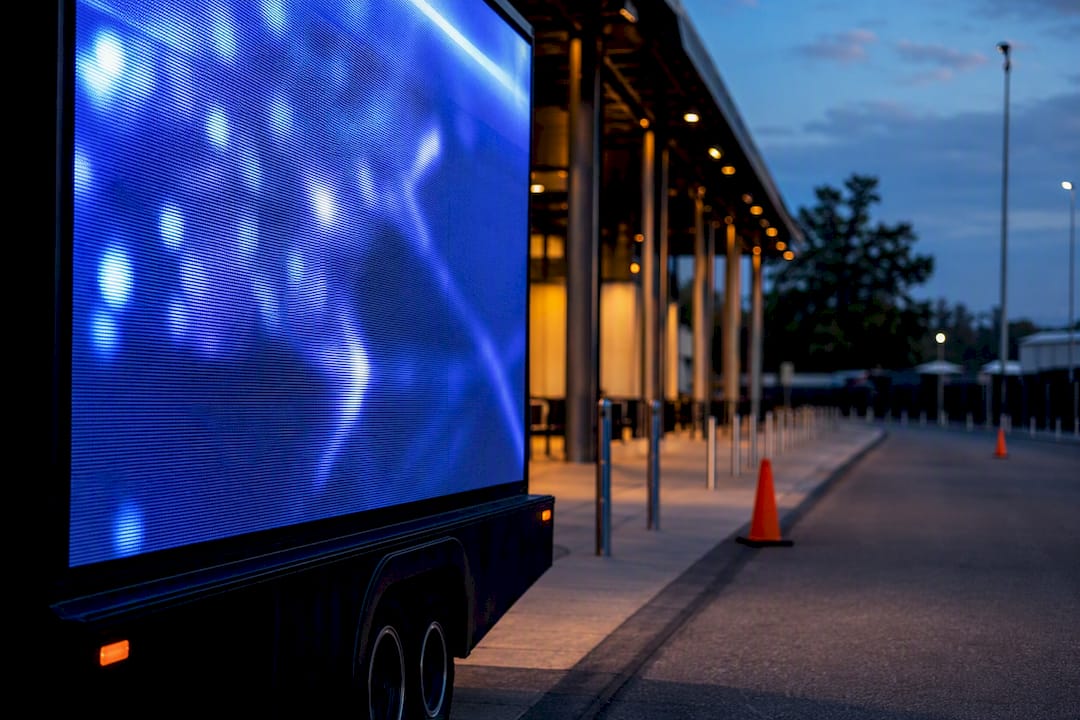
Geopath measurement is the out-of-home industry’s standard audience rating. It estimates how many people have an opportunity to see an ad, and how many are likely to notice it, using traffic circulation, a visibility adjustment and mobile location data. It is built for planning and buying. It is not a live report on what happened during your campaign. This guide covers what the system measures, what the 2025 dataset changed, and how to combine it with attribution data.
TL;DR
- Geopath converts traffic circulation into impressions with a Visibility Adjustment Index, giving buyers and sellers a shared “who, when and where” for OOH.
- Its figures are annual averages and probabilistic models. They are good for planning and comparing, not for real-time tracking.
- The 2025 dataset moved to a denser road network, so old benchmarks may not compare cleanly with new numbers.
- For mobile OOH such as LED trucks and wrapped rideshare cars, pair syndicated planning data with GPS proof-of-posting, geofencing and QR scans to see what actually happened.
Table of Contents
- What Geopath measures
- The standard behind the standard
- What changed in the 2025 dataset
- What Geopath does not tell you
- Pairing Geopath with campaign attribution
- A worked example: a trade show week
- Our perspective: treat Geopath as the denominator, not the verdict
- Questions to ask any OOH vendor about measurement
- Run a measurable mobile campaign with us
- FAQ
- Sources
What Geopath measures
Geopath describes its system as audience location measurement: it applies mobile location data to the old question of how many people pass an ad and how many see it. Two terms matter most.
- Opportunity to see (OTS): people who pass a unit under conditions that give them a chance to see it.
- Likely to see (LTS): the share of that traffic estimated to notice the ad, after adjusting for size, orientation and visibility.
The bridge between them is the Visibility Adjustment Index (VAI). Circulation, meaning total traffic, is converted to impressions by accounting for how large the unit is, which way it faces and how likely a passerby is to notice it. Geopath’s high-level measurement process combines third-party source data with this proprietary visibility model.
The stated goal is to supply the who, when and where of OOH audiences so buyers and sellers can transact with confidence. That is a currency, in the same sense that ratings are a currency in TV.
Where the audience data comes from
Geopath’s research methodology starts with an audited database of hundreds of thousands of media units, each checked with GIS and GPS data. Audience composition then comes from mobile devices. According to the measurement process documentation, a device’s “home” census block is the one where it dwells longest, and demographics are attached from there.

That is why Geopath can tell you the age, income or household profile of people likely exposed to a roadside unit. It is an estimate built from movement patterns, not a count of identified individuals.
The standard behind the standard
The Media Rating Council (MRC) publishes out-of-home measurement standards. Three points matter to buyers:
- Measurement occurs at the display level, so it can be rolled up into campaign reporting.
- The standards separate “Venue Traffic” (potential unduplicated people in a place) from “Viewable Impressions” (people with a specific opportunity for exposure).
- Audience estimates are expected to be independently verified and audited.
The MRC also cautions against custom measurement methods where possible. A syndicated approach puts everyone on the same footing and lowers the risk of double counting or inflated reach when proprietary numbers are mixed with industry datasets without validation. In practice: if a vendor quotes impressions, ask which method produced them.
What changed in the 2025 dataset
According to Geopath’s 2025 dataset summary, the update replaced the 2016 HERE Maps road network with the 2023 OpenStreetMap network and refreshed reach and frequency models with 2023 to 2024 movement trends. It uses nearly twice the vehicular reference points and nine times the pedestrian reference points of the previous dataset. The 2025 data became the default standard in late August 2025.
| Area | Before | 2025 dataset |
|---|---|---|
| Road network | 2016 HERE Maps | 2023 OpenStreetMap |
| Vehicular references | Baseline | Nearly 2x |
| Pedestrian references | Baseline | About 9x |
| Reach and frequency | Prior model | Updated roadside model |
What this means for your plans
The denser reference network can shift baseline circulation estimates. If you compare a 2025 plan with a benchmark from an earlier year, part of the difference may be the method rather than the market. Rebuild comparisons on the same dataset year before you tell a client that a market “grew” or “shrank.”
The reach and frequency update matters too. Geopath says its reach and frequency one-pager describes a model designed to fix cases where adding inventory did not produce predictable reach gains, so “what-if” analysis on packages should be more dependable. The model is probabilistic, and it accounts for audience duplication across overlapping trip paths. Adding a tenth unit in the same corridor does not add a tenth of new people.

If you manage several data sources at once, a worked example of consolidating them is this case study on merging disconnected data into one forecasting model. The principle carries over to media planning: agree on one set of definitions before you merge anything.
What Geopath does not tell you
Geopath gives you an annual average baseline. It does not tell you whether the 4 p.m. Thursday pass of your truck outside a convention center produced a scan, a visit or a lead. Its own documentation frames syndicated measurement as the “who” and “how many” for strategic planning, with mobile attribution platforms covering the real-time “what happened.”
There are three practical gaps:
- Time resolution. Averages smooth out a single event weekend, a game day or a trade show.
- Outcome. Impressions are opportunities, not actions.
- Mobile units. A moving LED truck or a rideshare car does not sit at a fixed, audited location, so campaign proof needs route and time records rather than a static unit rating.
Pairing Geopath with campaign attribution
Think of it as two layers.
| Layer | Question it answers | Typical source |
|---|---|---|
| Planning currency | How large and what kind of audience does this market or route reach? | Geopath syndicated data |
| Campaign proof | Where and when did the ads run, and what did people do? | GPS and photo proof-of-posting, geofencing, QR scans, visit lift |
A sensible workflow:
- Set the audience goal using syndicated data. Pick markets and corridors by the audience composition you need.
- Define the action. A scan, a booth visit, a store visit, a form fill. Decide before launch.
- Record the delivery. Require time-stamped GPS and photo proof for every route.
- Capture response. Use unique QR codes per vehicle or route so scans can be tied back.
- Report both layers separately. Show estimated exposure and measured response side by side, and do not blend them into one inflated reach number.
On the reporting side, the same discipline applies as in any channel. This overview of why agencies measure performance is about SEO, but its argument that reporting should tie work to outcomes translates directly to OOH.
We go deeper on the response layer in our guides to comprehensive attribution analytics, geofencing paired with mobile OOH to prove visit lift and smart QR codes.
A worked example: a trade show week
Say a software company wants attention around a downtown conference. Here is how the two layers divide the work.
- Planning: Use syndicated audience data to understand the corridors between the hotels and the venue, and which have the professional-heavy audience you want.
- Execution: Run an LED billboard truck on a customized route during arrival and badge-pickup hours. Add a geofence around the venue to support retargeting.
- Proof: Collect GPS and photo records for each pass.
- Response: Put a smart QR code on the creative offering a booth appointment, and compare scan timing against route timing.
The syndicated figures tell the client the audience was plausible. The campaign data tells the client what it did. If you are planning an event push, read how to target conferences and trade shows with LED mobile billboards.
Our perspective: treat Geopath as the denominator, not the verdict
We sell mobile out-of-home: LED billboard trucks and wrapped rideshare vehicles across all 50 states, tied to geofencing, route customization, audience filtering, real-time retargeting and smart QR codes. Buyers often ask us for one number that proves the campaign worked. There isn’t one, and we think it is a mistake to look for it in a syndicated rating.
We use Geopath-style thinking for what it does well: a common language for audience size and composition, so a plan can be compared with other media on fair terms. Then we hold ourselves to a different standard for delivery. A moving unit has to prove where it was and when, which is why we build campaigns around proof-of-posting with GPS and photo tracking and attribution reporting.
Our advice to marketers and agencies is simple. Ask every vendor, us included, to separate the estimated audience from the measured outcome. If a report merges them, you cannot defend it to your CFO. If it keeps them apart, you can.
— Scott
Questions to ask any OOH vendor about measurement
- Which dataset year are these impressions based on?
- Are the audience figures syndicated, or custom? If custom, how were they validated?
- Is reach deduplicated across units, or summed?
- What proof of delivery do I receive, and in what format?
- How will response (scans, visits, leads) be tied to specific routes or vehicles?
- Can I get raw location and timing data for audit?
The answers show quickly whether you are buying a measured campaign or a media estimate with a nice cover.
Run a measurable mobile campaign with us
If you want the audience context and the proof in one plan, we build LED mobile billboard and wrapped rideshare campaigns with geofencing, route customization, smart QR lead capture, proof-of-posting and attribution reporting. To see how to validate results quickly, start with our guide on proving mobile billboard effectiveness in two weeks.
FAQ
What is the Geopath methodology?
Geopath audited media units are matched with road and pedestrian networks, traffic volumes and mobile location data. Circulation is converted to impressions with a Visibility Adjustment Index, and reach and frequency are modeled for packages. The output is an annual planning dataset used by agencies, operators and brands.
Is Geopath measurement real-time?
No. It is based on annual averages of movement patterns and is meant for planning and comparison. For what happened during a live campaign, use attribution data such as GPS proof-of-posting, geofencing and QR scans.
Can I compare 2025 Geopath numbers with earlier years?
Carefully. The 2025 dataset moved from the 2016 HERE Maps network to 2023 OpenStreetMap and uses far more reference points, so some changes in estimates come from the method. Compare plans built on the same dataset year whenever you can.
Does Geopath apply to mobile billboards and rideshare ads?
Geopath covers roadside, transit and place-based media, but a moving unit’s exact route and timing are not captured by a fixed-location rating. For mobile OOH, ask for route-level proof such as GPS and photo records, and use syndicated data to frame the audience.
Sources
- Geopath: Methodology
- Geopath: High-Level Media Measurement Process
- Geopath: Research Methodology, Measuring Out of Home Audiences
- Media Rating Council: OOH Measurement Standards
- Geopath: 2025 Dataset, What Has Changed
- Geopath: 2025 Reach and Frequency One-Pager