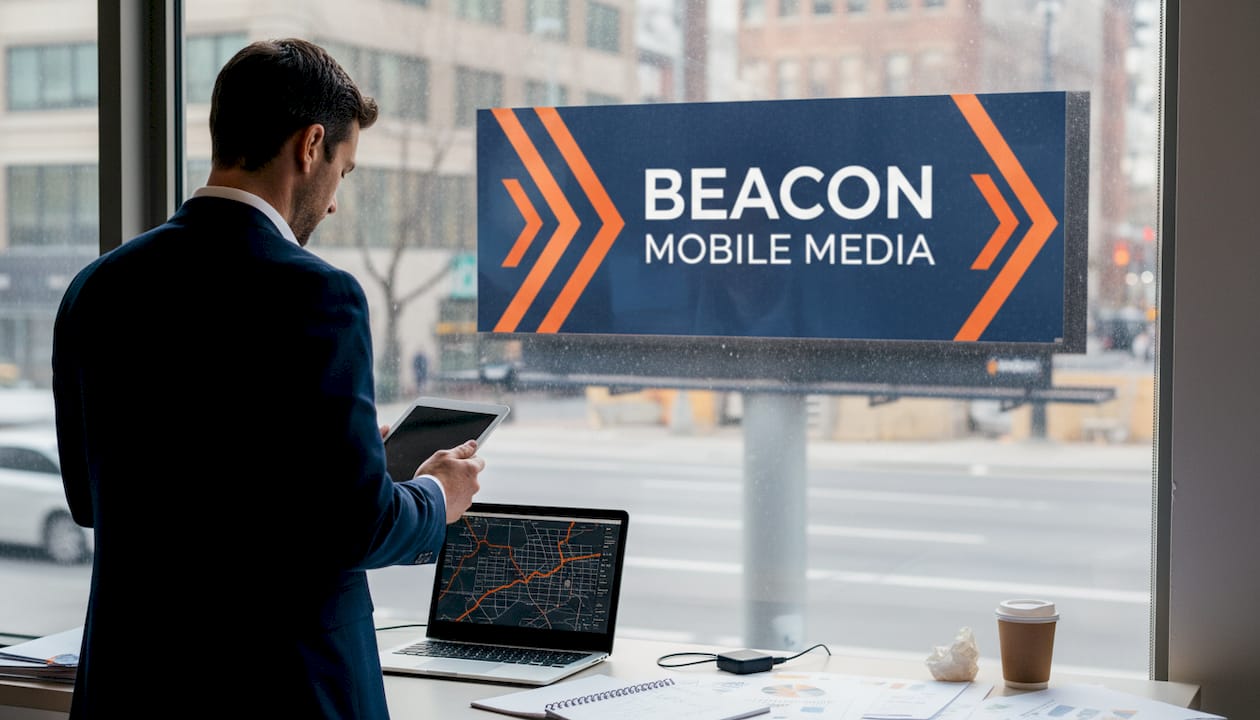
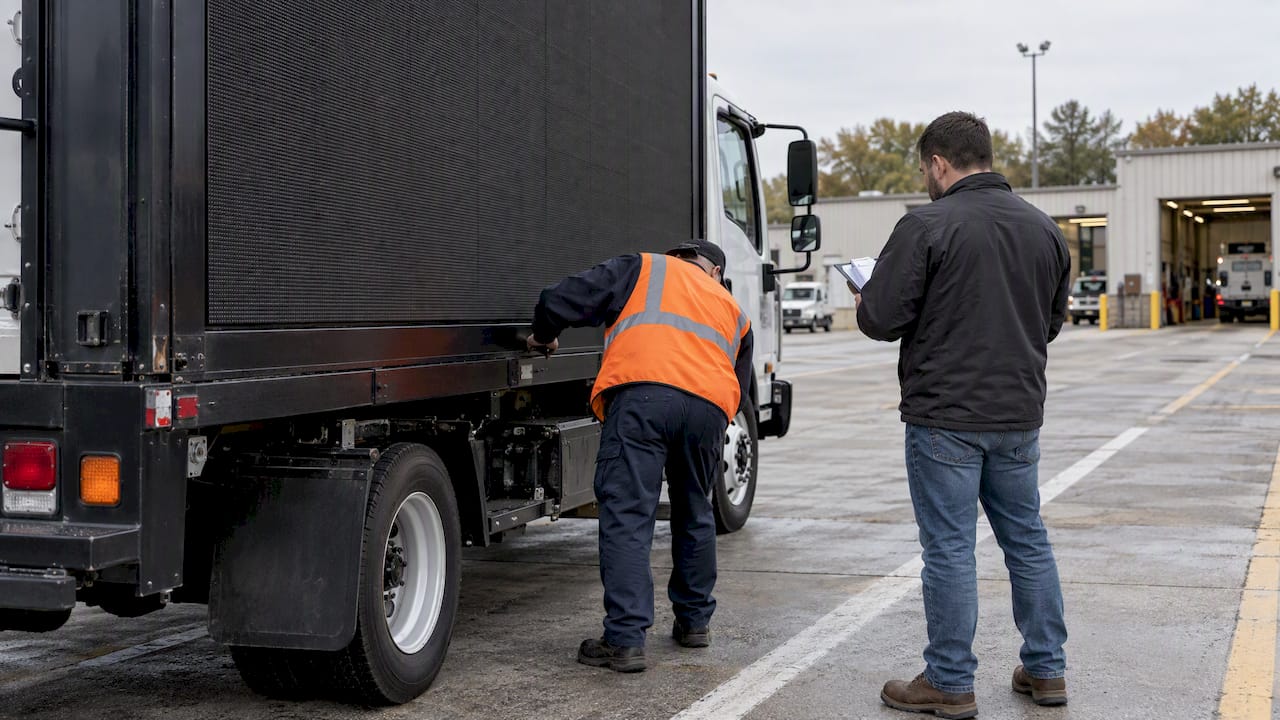
Out-of-home (OOH) advertising is defined as any paid media that reaches consumers outside their homes, including billboards, transit displays, and mobile LED trucks. Maximizing ROI with OOH ads requires combining data-driven audience targeting, high-quality creative, strategic placement, and accurate measurement. OOH delivers a median 20% lift in in-person outcomes, double the performance of TV. That number reframes OOH from a brand-awareness luxury into a performance channel worth serious budget attention.
How to maximize ROI with OOH ads through data-driven targeting
Wasted impressions are the fastest way to destroy an OOH budget. The fix is audience segmentation built on real behavioral data, not demographic guesses.

Zip-code-level search data and foot-traffic analytics reveal exactly where your best customers live, work, and shop. Geolocation data from mobile devices shows which neighborhoods index highest for your category. Behavioral data, such as purchase history and app usage patterns, lets you build audience profiles that map directly to physical locations. When you know where your audience concentrates, you stop buying reach and start buying relevance.
Targeted out-of-home advertising uses three primary data types to sharpen placement decisions:
- Geolocation data: Real-time and historical mobile location signals that identify high-density audience zones
- Foot-traffic analytics: Aggregated visit data from retail, venues, and transit hubs that measures dwell time and visit frequency
- Affinity and behavioral data: Purchase signals, app categories, and interest clusters that match audiences to brand categories
- Zip-code search trends: Local search volume by category that reveals demand concentration at the neighborhood level
The ROI impact of each data type differs. Geolocation and foot-traffic data directly reduce wasted impressions by placing ads where your audience physically appears. Affinity data adds a layer of intent, helping you prioritize locations where audiences are already in a buying mindset.
Pro Tip: Before buying any OOH placement, run a foot-traffic index report for your top three customer zip codes. If a proposed location does not appear in those zones, negotiate a swap or pass entirely.

Beacon-ads applies data-driven OOH strategies through route customization and affinity targeting, routing LED mobile billboards through the specific neighborhoods where client audiences concentrate most.
How does location selection affect outdoor advertising effectiveness?
Location is not just about traffic volume. The best OOH placements combine high reach with contextual relevance, placing your message where audiences are already primed to act.
Dwell time matters as much as raw impressions. A billboard near a highway exit delivers a two-second glance. A wrapped vehicle parked outside a stadium during a three-hour event delivers repeated exposure to a captive audience. Retail adjacency adds another layer: placing OOH within 500 feet of a point of purchase shortens the gap between exposure and conversion.
Rotating and testing locations is a practice most brand managers skip, but it compounds returns over time. Running the same creative in three different location tiers, then comparing foot-traffic lift and branded search volume by zone, reveals which placements actually drive outcomes versus which ones just log impressions.
A practical framework for location prioritization:
- Tier 1 locations: High-traffic corridors with long dwell times, such as transit hubs, stadiums, and event venues. Best for frequency building.
- Tier 2 locations: Retail-adjacent placements within walking distance of your category. Best for conversion proximity.
- Tier 3 locations: Residential and commuter routes in high-index audience zip codes. Best for broad reach at lower cost.
- Test rotations: Swap 20% of your placement budget across tiers each month and track performance by zone.
Pro Tip: Balance reach and frequency by tier. Tier 1 locations build frequency fast but cost more per placement. Tier 3 locations extend reach cheaply but require longer flights to accumulate enough exposures to move conversion rates.
Does creative quality actually drive OOH campaign performance?
Creative quality is the single largest controllable variable in OOH performance. 70% of OOH campaigns show a direct correlation between creative quality and brand lift. That finding means your media buy is only as good as the creative running on it.
The core mistake brand managers make is repurposing digital ads for OOH placements. A social media graphic designed for a five-inch screen fails at 14 feet. OOH creative needs to communicate one idea in under three seconds, with a visual hierarchy that works at distance and at speed. Text-heavy designs, small logos, and cluttered layouts all suppress recall.
Dynamic and video creative in digital OOH delivers 2.5 times higher returns than static designs. The reason is attention. Motion captures peripheral vision and holds it longer than a static image. Dynamic creative also enables contextual relevance, showing different messages by time of day, weather, or local event.
Principles that separate high-performing OOH creative from average work:
- One message, one visual: Strip every element that does not support the core claim
- High contrast color: Designs that read clearly against variable backgrounds and lighting conditions
- Logo placement at scale: Brand marks sized for recognition at 50 feet, not 12 inches
- Call to action simplicity: A URL, QR code, or phone number, never all three at once
- Medium-specific testing: Score creative against OOH-specific attention metrics before production, not after
Top-performing campaigns treat creative as a performance lever, investing in tailored designs rather than repurposed assets. The production cost difference between a recycled digital graphic and a purpose-built OOH creative is small. The performance difference is not.
Pro Tip: Use an OOH-specific creative scoring framework before finalizing any design. Score each asset on legibility at distance, message clarity in three seconds, and brand recognition without reading the tagline. Reject any asset that fails two of the three.
How does integrating OOH with digital campaigns improve attribution?
OOH works harder when it runs alongside digital channels. The combination creates a feedback loop: physical exposure drives branded search, which digital campaigns then capture and convert.
Programmatic DOOH enables campaign management across digital screens, mobile, and social from a single interface with unified budgeting and reporting. That integration removes the siloed reporting problem that makes OOH look underperforming on paper. When you can see branded search lift, website traffic spikes, and in-store visits alongside OOH impression data, the channel’s contribution becomes visible.
Geofencing and shadowfencing extend OOH reach into digital channels. Geofencing draws a virtual boundary around an OOH placement and serves mobile ads to devices that enter that zone. Shadowfencing retargets audiences who were exposed to a physical OOH unit, then follows them with digital ads across apps and browsers. Both techniques close the gap between physical exposure and digital conversion.
Key integration tactics that improve both reach and measurement:
- Branded search monitoring: Track search volume for your brand name and key product terms in markets where OOH is running. Lift in branded search is a reliable signal of OOH exposure.
- Web traffic segmentation: Isolate traffic from OOH markets and compare conversion rates against control markets without OOH.
- Social retargeting: Serve social ads to audiences geofenced around OOH placements to reinforce the message across channels.
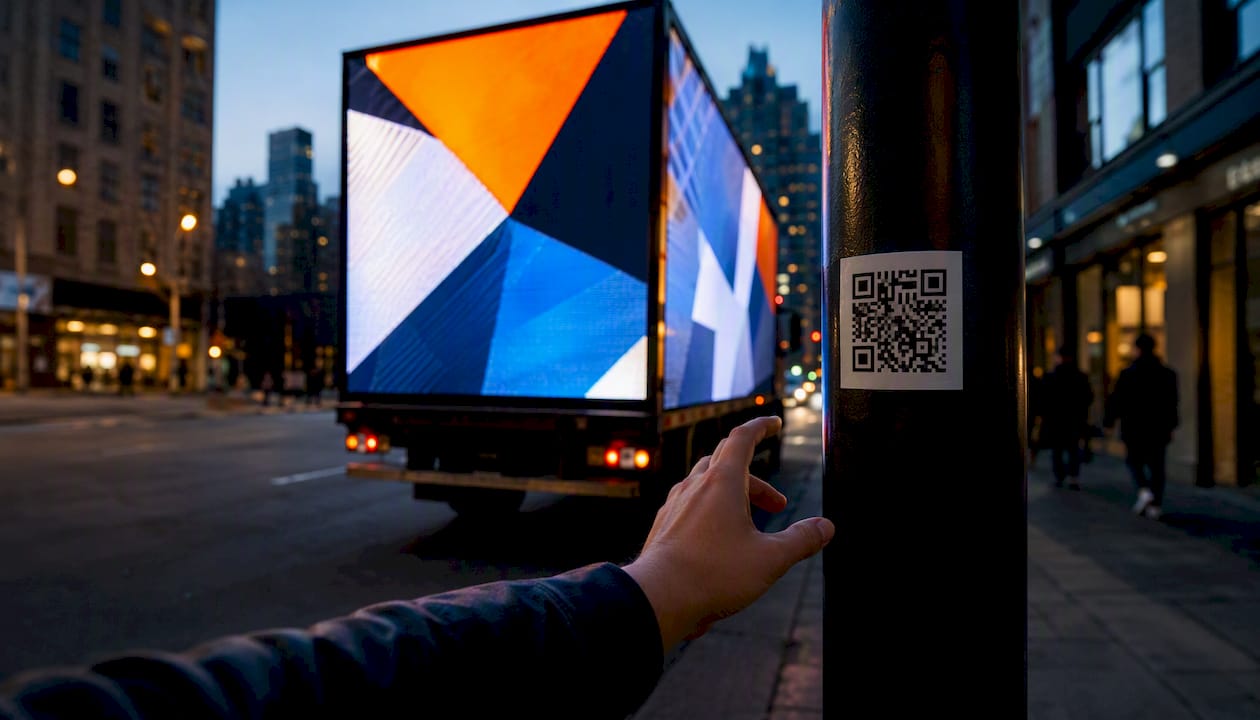
- QR code engagement: Smart QR codes on OOH units capture direct scan data, providing a measurable conversion path from physical exposure to digital action.
The challenge is attribution timing. OOH drives delayed responses. A consumer who sees a billboard on monday may search for the brand on thursday. Direct attribution models miss that gap entirely.
How do you measure OOH campaign ROI accurately?
Measuring OOH ROI accurately requires moving beyond direct attribution models designed for digital channels. Applying digital-first attribution to OOH underestimates its real impact because it misses organic search lift, brand traffic, and in-store visits that occur days or weeks after exposure. Short attribution windows kill the channel’s measured performance, not its actual performance.
Marketing Mix Modeling (MMM) is the most reliable method for capturing OOH’s full contribution. MMM captures over 90% of OOH’s effect, compared to less than 10% captured by vanity URLs or QR codes alone. MMM works by isolating each channel’s contribution to sales outcomes across a defined time period, accounting for delayed effects and cross-channel interactions. AI-supported attribution models are making MMM more accessible for mid-market brands that previously lacked the data infrastructure to run it.
Campaign duration directly affects measured ROI. Campaigns running longer than two months see approximately 79% higher ROI due to compounding frequency effects. Short flights do not accumulate enough exposures to move the metrics that MMM captures. Frequency is the mechanism: increasing OOH exposure from 1 to 10 impressions produces a 5.3x increase in digital conversion rates.
The KPIs that matter most for OOH measurement:
| KPI | What it measures |
|---|---|
| Branded search lift | Increase in brand name searches in OOH markets vs. control markets |
| Foot-traffic lift | Change in store or venue visits attributable to OOH exposure |
| Brand recall score | Aided and unaided recall measured via post-campaign surveys |
| Web traffic index | Session volume from OOH markets compared to baseline |
| MMM contribution | OOH’s isolated share of total sales outcomes over the campaign period |
Pro Tip: Set your attribution window at a minimum of 30 days post-exposure for OOH campaigns. Anything shorter will undercount the channel’s contribution and lead to budget cuts that hurt overall marketing performance.
Key Takeaways
Maximizing ROI with OOH advertising requires data-driven targeting, purpose-built creative, strategic location selection, digital integration, and measurement models that account for delayed consumer responses.
| Point | Details |
|---|---|
| OOH outperforms TV | OOH delivers a median 20% in-person lift, double the performance of TV. |
| Creative drives brand lift | 70% of campaigns show a direct link between creative quality and brand lift. |
| Frequency compounds returns | Campaigns longer than two months see approximately 79% higher ROI. |
| MMM beats direct attribution | Marketing Mix Modeling captures over 90% of OOH’s effect vs. less than 10% for QR codes alone. |
| Budget allocation matters | Brands investing more than 6% of media budgets in OOH see a 57% return rate vs. 41% for lower spenders. |
What I’ve learned about OOH ROI that most guides won’t tell you
The biggest mistake I see brand managers make is treating OOH like a digital channel with a longer lead time. It is not. OOH operates on a different cognitive model. It builds memory structures through repeated physical exposure, not through clicks and conversions. When you measure it like a paid search campaign, you will always conclude it underperforms. That conclusion is wrong, and it is expensive.
The shift that changes everything is moving from vibe-based marketing to data-backed attribution. Most teams I have worked with know their OOH is working because sales go up in markets where they run it. But they cannot prove it in a budget meeting. MMM solves that problem. Once you can show the isolated contribution of OOH to revenue, the channel defends itself.
The other thing I would push back on is the instinct to run short flights. A four-week OOH campaign almost never moves the needle enough to justify the production and placement costs. Commit to at least two months, build frequency deliberately, and watch what happens to your branded search volume. The data will follow the exposure.
— Scott
How Beacon-ads helps brands get measurable results from OOH
Beacon-ads combines mobile LED billboards and wrapped rideshare vehicles with geofencing, real-time retargeting, and attribution analytics to give brand managers the measurement infrastructure OOH campaigns need.

The platform routes campaigns through high-index audience zones, integrates smart QR code tracking for direct engagement data, and provides proof-of-posting documentation alongside funnel metrics. For brand managers ready to move beyond static placements and guesswork reporting, Beacon-ads’ 2026 OOH formats guide covers every format category and the data strategies that make each one perform. The reporting infrastructure is built to support MMM inputs, so your measurement model gets the clean data it needs.
FAQ
What is the average ROI lift from OOH advertising?
OOH delivers a median 20% lift in in-person outcomes and 14% in digital outcomes, which is double the performance lift of TV according to OAAA and Kochava research.
How long should an OOH campaign run to maximize ROI?
Campaigns running longer than two months see approximately 79% higher ROI due to compounding frequency effects. Short flights do not accumulate enough exposures to move measurable outcomes.
What is the best way to measure OOH campaign performance?
Marketing Mix Modeling (MMM) is the most accurate method, capturing over 90% of OOH’s contribution to sales. Vanity URLs and QR codes alone capture less than 10% of the channel’s real effect.
Does creative quality affect OOH campaign results?
Creative quality directly correlates with brand lift in 70% of measured OOH campaigns. Purpose-built OOH creative consistently outperforms repurposed digital assets.
How does frequency affect OOH conversion rates?
Increasing OOH ad exposure from 1 to 10 impressions produces a 5.3x increase in digital conversion rates. Frequency management is one of the highest-leverage variables in OOH campaign planning.