Start with a simple, cross-channel engagement score that combines badge or QR scans, app interactions, and content clicks. That three-signal combination gives you the fastest repeatable read on who is actually engaged versus who just showed up. Here is what to enable first:
- Badge or QR scans: Capture physical presence and booth visits with timestamped scan data tied to a unique attendee ID.
- App events and polls: Record poll responses, Q&A submissions, agenda saves, and chat activity inside your event app or webinar platform.
- Content clicks and downloads: Track resource downloads, link clicks, and session replays to catch post-session interest.
Your concrete next step: connect your badge-scan feed and GA4 event tags into your CRM, then run a smoke test with five test attendees before the event opens. If all three data streams land in the same contact record with matching IDs, your tracking is ready.
Key Takeaways
Combining badge or QR scans, app interactions, and content clicks into a single engagement score gives event teams the fastest, most repeatable path from raw attendance data to pipeline-driving follow-up.
| Point | Details |
|---|---|
| Start with three signals | Badge or QR scans, app events, and content clicks form the minimum viable engagement score. |
| Use formulas, not gut feel | Participation rate, session completion, and meeting-booking rate are the metrics leadership and sponsors actually act on. |
| Weight by intent, not volume | A meeting booked (10 pts) outweighs three poll responses (3 pts) because intent predicts pipeline. |
| Consent state in every payload | Tag consent_granted on each analytics event to keep data compliant and auditable across U.S. state laws. |
| Beacon-ads closes the outdoor gap | Smart QR codes and geofence attribution from Beacon-ads connect outdoor activations to in-room CRM records for unified sponsor reporting. |
Table of Contents
- What are the best engagement tracking methods for events?
- Which engagement metrics actually matter, and how do you calculate them?
- How do you weight engagement signals into a scoring model?
- What systems do you need to connect for reliable tracking?
- What privacy and consent practices apply to U.S. event tracking?
- Pre-event, day-of, and post-event implementation checklist
- What event measurement practitioners get wrong most often
- How Beacon-ads helps events capture and act on engagement data
- Sources
What are the best engagement tracking methods for events?
Attendance headcount is the floor, not the ceiling. The engagement tracking methods that actually move the needle capture what people did, not just that they showed up. Below is a breakdown of the methods worth instrumenting, what each one measures, and when it earns its place in your stack.
| Method | Signal measured | Primary metric(s) | Best for |
|---|---|---|---|
| Badge / RFID scan | Physical presence, booth visit | Scans per attendee, dwell time | Trade shows, multi-session conferences |
| Smart QR codes | Intent, content interest | Scan count, scan-to-conversion rate | Outdoor activations, sponsor booths, printed collateral |
| Session check-in (app or door scan) | Session attendance | Attendance per session, completion rate | Multi-track conferences |
| App interactions (polls, chat, agenda) | Active participation | Poll response rate, chat messages, agenda saves | Virtual and hybrid events |
| Webinar join / duration | Attention quality | Average watch time, drop-off point | Webinars, virtual summits |
| Meeting bookings / one-to-ones | Purchase intent | Meetings booked, meetings held | B2B trade shows, hosted-buyer events |
| Resource clicks and downloads | Content interest | Download rate, click-through rate | Content-heavy conferences |
| Social listening / hashtag tracking | Organic amplification | Mentions, reach, sentiment | Consumer events, product launches |
| Passive sensing (beacons, dwell time) | Foot traffic patterns | Dwell time per zone, return visits | Large expo halls, multi-zone venues |
Implementation notes worth keeping in mind:
Timestamping every event is non-negotiable. Without it, you cannot reconstruct the attendee journey or detect anomalies like a badge scan that fires after a session ends. Use a consistent attendee identifier across every system, whether that is an email hash, a registration ID, or a UUID, and decide on it before the event opens. Sync cadence matters too: badge scans and app events should push to your CRM at least every 15 minutes during the event, not in a nightly batch that arrives after your sales team has already started calling.
For passive sensing, the signal is real but the implementation hurdle is high. Bluetooth beacons require hardware placement, calibration, and a mobile app with location permissions. Save that layer for large-scale expos where foot-traffic routing is a genuine business question.
Pro Tip: *Relying on a single KPI is the primary pitfall in event measurement. Pair quantitative signals like scan counts with qualitative ones like Q&A themes and chat topics.
Which engagement metrics actually matter, and how do you calculate them?
Metrics without formulas are just labels. Here are the core event engagement KPIs, their exact calculations, and the business outcome each one most directly supports.
Core formulas:
- Registration rate = Registrations ÷ Invitations sent × 100
- Attendance rate = Unique check-ins ÷ Registrations × 100
- Participation rate = Unique participants in a poll or Q&A ÷ Attendees present × 100
- Session completion rate = Attendees who stayed through session end ÷ Attendees who joined × 100
- Average session duration = Total minutes watched ÷ Unique session joins
- App adoption rate = Unique app logins ÷ Total registered attendees × 100
- Resource download rate = Total downloads ÷ Unique attendees × 100
- Meeting-booking rate = Meetings booked ÷ Attendees eligible to book × 100
- Lead conversion rate = Leads who took a post-event action ÷ Total leads captured × 100
- Net Promoter Score (NPS) = % Promoters (9–10) minus % Detractors (0–6)
Example calculation: At a 500-person conference, 210 attendees respond to a live poll. If the participation rate is low, the topic or format may need a rethink.
Meetings booked and meetings held are the KPIs leadership tends to care about most because they map directly to pipeline and qualified opportunities. Track both: a high booking rate with a low held rate signals a scheduling or no-show problem worth fixing before the next event.

| Metric | Business outcome it supports |
|---|---|
| Attendance rate | Event ROI baseline, sponsor audience guarantees |
| Participation rate | Content quality, speaker effectiveness |
| Session completion rate | Content depth, format fit |
| App adoption rate | Data richness, platform engagement |
| Meeting-booking rate | Pipeline generation, sponsor ROI |
| Lead conversion rate | Revenue attribution |
| NPS | Retention, brand equity |
| Resource download rate | Content ROI, post-event nurture quality |
For app and web sessions, instrument active_time rather than raw time-on-page. Active time and session engagement summaries filter out background tabs and idle periods, giving you a higher-fidelity read on true attendee attention than pageviews alone.
How do you weight engagement signals into a scoring model?
Raw signal counts are useful. A prioritized score that routes leads to the right team is better. Engagement scoring turns event actions into a prioritized list that helps route leads and prove pipeline impact. Here is a copy-and-paste matrix to start from.
| Action | Points | Context tag |
|---|---|---|
| Session check-in (30+ min) | 5 | session_topic |
| Poll or Q&A response | 1 | session_topic |
| Resource download | 3 | content_type |
| Booth visit (badge scan) | 5 | sponsor_name |
| Product question asked | 8 | product_name |
| Meeting booked | 10 | rep_name |
| Social share with event hashtag | 2 | channel |
| Replay viewed (post-event) | 3 | session_topic |
Threshold routing:
- 0–14 points: Add to nurture sequence. Send a post-event content digest.
- 15–39 points: Flag for marketing follow-up within 5 business days. Personalize outreach by top context tag.
- 40+ points: Route to sales for outreach within 48 hours. Include a summary of their top actions in the CRM record.
The rationale for weighting behavioral signals over raw attendance comes down to intent. Someone who books a meeting and asks a product question has signaled readiness to buy. Someone who attended three sessions but never interacted has shown interest, not intent. Treat them differently.
Early signals and late signals also deserve separate treatment. Meeting bookings and agenda saves before the event indicate intent. Replay views and resource downloads in the week after indicate sustained interest. Weight them differently in your follow-up logic: early-signal leads get a sales call, late-signal leads get a content nurture sequence. This distinction is worth building into your CRM field mapping from the start.
Adding a context tag to every scored action is what makes follow-up feel personal rather than generic. A lead who scored 45 points across sessions tagged product_name: Platform Pro and a booth visit tagged sponsor_name: Acme Corp should get a different email than a lead who scored 45 points across general sessions. The score routes them; the tags personalize the message. For a deeper look at tying these signals to ad spend and sponsor ROI decisions, the connection between engagement scores and budget allocation is direct.

What systems do you need to connect for reliable tracking?
Getting the data is one problem. Getting it into the right place, with the right labels, is the harder one. Here is the implementation checklist for instrumenting and integrating your event tracking stack.
-
Define a unique attendee ID strategy. Pick one identifier (email hash, registration UUID) and enforce it across every system before any data flows. Mismatched IDs are the single most common reason event data arrives in CRM as duplicate or orphaned records.
-
Instrument GA4 event tags. GA4 accepts recommended and custom events via gtag() or Google Tag Manager, grouped into automatically collected, enhanced measurement, recommended, and custom categories. For events, use custom events with a minimal parameter set:
action,session_id,timestamp,topic, andvalue. Keep naming consistent:session_join,poll_response,resource_download,meeting_booked. -
Connect badge-scan or lead-retrieval hardware. Most trade-show badge systems export CSV or push via API. Map their output fields to your CRM contact fields before the event. Test the field mapping with a sample export.
-
Set up your CRM or marketing automation integration. Map every event action to a CRM activity or custom field. Salesforce, HubSpot, and Marketo all support webhook or API ingestion. Decide on sync cadence: near-real-time (webhook) for meeting bookings and high-score triggers; batch (every 15 minutes) for session check-ins and poll responses.
-
Add smart QR codes for scan-based capture. Each QR code should encode a unique URL with UTM parameters so scans land in GA4 as tagged sessions. Beacon-ads’s smart QR flows push scan events with geofence and route context, which means a scan at a sponsor booth outside the venue can carry the same attendee ID as an in-room badge scan, giving you a unified attribution picture.
-
Instrument your webinar or virtual platform. Most platforms (Zoom Webinars, ON24, Hopin) export join/leave timestamps and poll responses. Pull these into the same CRM contact record using the attendee email as the join key.
-
Set up social listening. Tools like Brandwatch or Sprout Social can track your event hashtag in near-real-time. Feed mention counts and sentiment scores into your event dashboard as a supplemental signal.
-
Enable a real-time dashboard. Pull badge scans, app adoption, and session attendance into a live view. Real-time dashboards let teams act during the event: re-route attendees to underperforming sessions, push notifications to boost adoption, or troubleshoot a sponsor booth before the day ends.
-
Handle timezone and timestamp normalization. Store all timestamps in UTC. Convert to local time only for display. A session that starts at 9:00 AM Pacific and ends at 10:30 AM Pacific should not show a 90-minute duration for an attendee whose device is set to Eastern time.
-
Run a pre-event smoke test. Simulate five attendee journeys end-to-end: scan a badge, respond to a poll, download a resource, book a meeting. Confirm all five actions appear in GA4 and CRM with matching IDs and correct timestamps before the event opens.
For mobile advertising tools that support multi-stage event tracking, the integration between outdoor activations and in-room tracking is increasingly where the most interesting attribution data lives.
What privacy and consent practices apply to U.S. event tracking?
U.S. event tracking does not fall under a single federal privacy law, but that does not mean anything goes. State laws (California’s CPRA, Virginia’s CDPA, Colorado’s CPA) and sector-specific rules create real obligations, especially for consumer-facing events. Here is the practical checklist.
- Notice and consent at registration: Tell attendees what you are collecting, why, and who receives it. A one-paragraph privacy notice on the registration form is the minimum. For B2C events in California, explicit opt-in for data sharing with sponsors is required.
- Legitimate interest for B2B contexts: For B2B events where attendees register as business representatives, legitimate interest is a defensible basis for tracking professional behavior (session attendance, meeting bookings). Document your legitimate-interest assessment and keep it on file.
- QR-scan intent language: Every QR code that captures attendee data should carry a one-line disclosure at the point of scan: “Scanning connects your registration profile to this interaction.” Do not bury it in a footer.
- App and web consent popups: Event apps and web-based platforms that use GA4 or third-party analytics need a consent banner for attendees in states with opt-in requirements. Integrate consent state into every analytics payload: tag each GA4 event with a
consent_granted: true/falseparameter so you can filter non-consented data from reporting. - Data minimization: Capture only the identifiers you need for the follow-up action you have planned. If you are not using biometric dwell-time data for a specific business decision, do not collect it. Use hashed email addresses as identifiers wherever possible rather than storing plain-text PII in analytics systems.
- Retention limits: Set a data retention policy before the event. Most event engagement data has a useful life of 90–180 days for follow-up purposes. After that, aggregate or delete individual-level records.
- Vendor contracts: Every third-party tool in your stack (badge vendor, app provider, analytics platform) should have a data processing agreement (DPA) in place. Review what each vendor does with the data you send them.
Tag consent state with each analytics payload. It is the single most practical step for keeping your event data compliant and auditable without rebuilding your entire stack.
Pre-event, day-of, and post-event implementation checklist
A tracking plan that exists only in a document is not a tracking plan. Here is the time-ordered checklist to make sure your measurement actually works.
Pre-event (2–4 weeks out):
- Define your engagement goals and map each goal to a specific signal (e.g., “measure sponsor ROI” maps to booth scans and meeting bookings).
- Assign a unique attendee ID format and document it in a shared spec.
- Instrument GA4 event tags and test with
debug_modeenabled. - Map badge-scan export fields to CRM contact fields and test with a sample file.
- Configure scoring rules in your CRM or MA platform.
- Run a full dry-run: simulate five attendee journeys and confirm data lands correctly.
Day-of:
- Open your real-time dashboard at least 30 minutes before doors open.
- Confirm badge-scan hardware is reading and pushing data. Check the first 10 scans manually.
- Monitor app adoption rate in the first hour. If adoption is low, push a notification or have staff prompt downloads at registration.
- Log any exceptions (hardware failures, integration errors) in a shared doc so post-event analysis accounts for gaps.
Post-event (within 48 hours):
- Merge all data feeds (badge, app, GA4, webinar, social) into a single attendee record using the shared attendee ID.
- Calculate engagement scores for every attendee.
- Segment into threshold buckets (nurture, marketing follow-up, sales outreach).
- Trigger follow-up sequences with personalized content based on context tags.
- Export a sponsor report showing booth scan counts, session attendance by topic, and meeting outcomes.
Dashboard fields to include in your master record:
attendee_id | engagement_score | top_actions | last_action_timestamp | session_list | consent_granted
For post-event lead generation workflows that tie engagement scores to nurture and conversion sequences, the segmentation step is where most of the revenue impact actually happens.
What event measurement practitioners get wrong most often
Most teams instrument too much and act on too little. The instinct to track everything is understandable, but it usually produces a dashboard nobody reads and a CRM full of fields nobody maps to a follow-up action.
Start with one strong signal type alongside your ID capture. Badge scans plus meeting bookings will tell you more about pipeline potential than fifteen signals with no scoring logic. Add layers once the first two are flowing cleanly into CRM. Postpone passive sensing, biometric dwell time, and social sentiment until your core stack is stable.
Two mistakes I see repeatedly in event tracking setups: inconsistent attendee IDs and late CRM syncs. Inconsistent IDs happen when the badge system uses email, the app uses a registration number, and the webinar platform uses a display name. You end up with three records for the same person and no way to score them accurately. Solve this in the spec document before any vendor touches a line of code.
Late CRM syncs are the other killer. If engagement data arrives in CRM 24 hours after the event ends, your sales team has already made cold calls with no context. Near-real-time sync for high-score triggers is not a nice-to-have for B2B events. It is the difference between a warm call and a cold one.
One more thing worth saying plainly: align your metrics to the stakeholder asking for the results. Sales wants meetings booked and pipeline. Sponsors want booth scans, session attendance by topic, and audience demographics. The content team wants session completion rates and replay views. Build three separate report views from the same data rather than one report that satisfies nobody.
How Beacon-ads helps events capture and act on engagement data
Beacon-ads solves that gap.

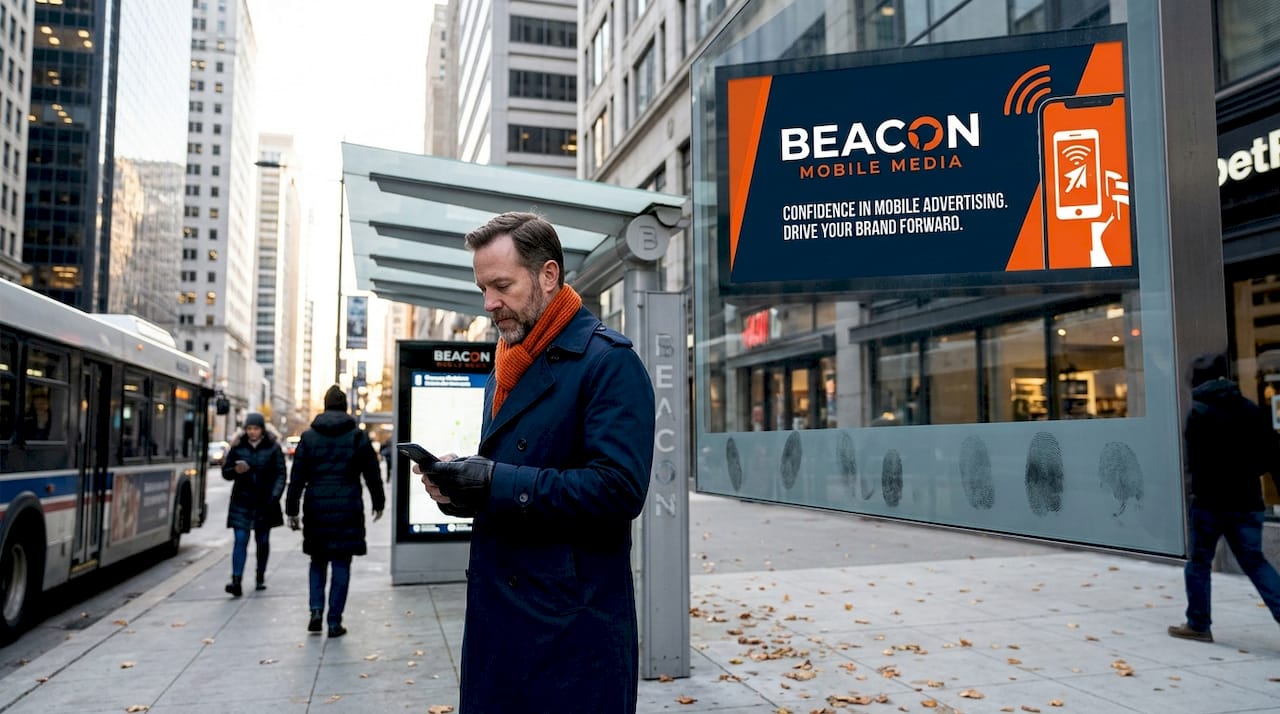
Beacon Mobile Media’s smart QR codes tie physical scans directly to digital attribution. A scan at a wrapped rideshare vehicle or LED billboard outside your venue carries a unique URL with UTM parameters, which means it lands in GA4 as a tagged session and in your CRM as a tracked touchpoint. Add geofence attribution and you can see which attendees were exposed to your outdoor campaign before they walked through the door, giving sponsors a reach-and-engagement story that badge data alone cannot tell. GPS and photo proof-of-posting closes the loop on placement verification, so your sponsor report has documentation, not just numbers.
The practical flow looks like this: a scan at a Beacon-ads billboard triggers a GA4 event, that event pushes to CRM, the CRM adds points to the attendee’s engagement score, and if the score crosses your threshold, a sales outreach sequence fires automatically. For conference and trade-show targeting with LED mobile billboards, that closed-loop attribution is what separates a measurable campaign from a visibility spend. Get a quote or check campaign availability at Beacon-ads.
Sources
- How Engagement Scoring Turns Event Data into Pipeline | Cvent Blog
- How to Measure and Improve Audience Engagement at Events
- Set up events | Google Analytics | Google for Developers
- How to Measure Event Success: Audience Engagement Edition | Splash
- Engagement Tracking Guide | DataLayer Tracker