Rideshare advertising delivers measurable ROI when you run in-vehicle screens or on-app placements during premium dayparts, layer in exterior wraps for reach, and commit to real measurement from day one. Skip the measurement piece, and you’re just guessing. The formats work because riders are captive for 8 to 22 minutes with nowhere to go and a captive attention environment.
What should you actually track?
- Brand lift, measured through a named third-party study
- Footfall attribution, tied to deduplicated mobile location panels
- Direct conversions through QR scans, promo codes, or phone-call tracking
Your first move: run a single-market pilot with device-level or third-party lift measurement built in before you scale spend anywhere else.
Key Takeaways
Rideshare advertising produces measurable ROI when you pair high-attention formats with layered timing and named third-party measurement, not platform impressions alone.
| Point | Details |
|---|---|
| Format choice drives cost and attention | In-vehicle screens run $10 to $25 CPM, on-app $15 to $30 CPM, exterior $4 to $6 CPM. |
| Measurement must go beyond impressions | Pair brand-lift studies and footfall panels with conversion tracking to validate real impact. |
| Best-fit verticals convert fastest | Nightlife, hospitality, entertainment, and post-venue moments consistently outperform other categories. |
| Creative needs to be short and QR-first | Ultra-concise offers with instant-value landing pages beat generic brand messaging in-ride. |
| Beacon builds measurement into the campaign | Beacon-ads pairs wrapped rideshare vehicles with geofencing, retargeting, and attribution analytics for reportable ROI. |
Table of Contents
- Rideshare Ad Formats and Cost Ranges: What Each Format Buys You
- How Do You Measure Rideshare Advertising ROI?
- Which Industries Get the Best ROI From Rideshare Ads?
- What Creative and Timing Work Best for Captive Riders?
- How Do You Calculate Rideshare Advertising ROI?
- Beacon’s Approach to Measurable Rideshare Campaigns
- Start a Measured Rideshare Pilot With Beacon
- Sources
Rideshare Ad Formats and Cost Ranges: What Each Format Buys You
Rideshare advertising splits into three formats, and each one buys you a different kind of attention. In-vehicle screens sit inside the car, usually mounted on the headrest or dash, and hold the rider’s eyes for the length of the trip. On-app placements, like Uber’s Journey Ads, show up inside the rider’s phone during the booking or waiting window. Exterior car-top displays and wraps turn the vehicle itself into a moving billboard for everyone outside the car.

Pricing tracks the attention each format earns. In-vehicle screens typically run $10 to $25 CPM, on-app placements run $15 to $30 CPM, and exterior car-top displays run $4 to $6 CPM. Most campaigns need $1,000 to $5,000 a month to see meaningful reach, and premium dayparts, think late-night entertainment hours or event evenings, push every one of those numbers higher.
Statistic Callout: Exterior formats cost roughly a quarter of what in-vehicle screens cost per thousand impressions, but that gap reflects the difference between glance-driven reach and captive, sustained attention.
The tradeoff is simple. In-vehicle screens beat on-app interstitials on attention quality, and on-app beats exterior placements, but exterior wins on raw reach per dollar. Pick based on whether you need eyeballs or impressions.
How Do You Measure Rideshare Advertising ROI?
Measuring rideshare advertising ROI comes down to three layers working together: platform-reported impressions, third-party verification, and conversion tracking that connects an ad to an actual sale.
- Platform impression data. Vendors report how many screens ran, for how long, and in which vehicles. This is your baseline, not your proof.
- Device-level attribution. Because the rider is holding the conversion device, in-vehicle QR scans and phone-based responses are unusually clean to track compared to most traditional out-of-home formats, where a billboard viewer’s later purchase is nearly impossible to link back.
- Third-party measurement. Brand-lift studies and footfall attribution through deduplicated mobile panels validate what the platform numbers claim, according to the Highfloor 2026 rideshare playbook.
Pro Tip: Never accept impression counts alone as proof of performance. Ask every vendor for a named third-party measurement partner before you sign, not after the campaign ends.
Each method has a catch. Platform impressions are fast and cheap but tell you nothing about actual behavior change. Brand-lift studies show shifts in awareness and favorability but cost more and take longer to field. Footfall attribution ties exposure to real-world visits, which is gold for retail and hospitality clients, but it needs a large enough sample to avoid noisy results.
The smartest approach triangulates. Pair brand lift with a conversion-event pixel or call-tracking number, and you get both the “did people notice” answer and the “did people act” answer. Relying on just one metric leaves you defending a campaign with half the story. Marketers who want a deeper framework for connecting spend to outcomes should look at how to track advertising ROI across formats, not just rideshare.
Which Industries Get the Best ROI From Rideshare Ads?
Some categories consistently outperform in rideshare, and the reasons come down to timing, not luck.
- Nightlife and events. Riders heading to or from a bar, concert, or game are primed for entertainment offers.
- Hospitality and food delivery. Hungry, tired, or traveling riders convert well on convenience messaging.
- Entertainment and ticketing. Impulse decisions happen fast in a moving car with nothing else to do.
- Legal and directional services. Post-incident or post-event moments (think DUI attorneys near bar districts) hit riders at the exact moment of relevance.
The strongest window is the “post-venue” ride, the trip home after a concert, game, or night out, when riders are relaxed, still processing the experience, and receptive to a related offer. Event-day campaigns around stadiums, arenas, and convention centers capture that same window at scale.
Where rideshare struggles is as a lone acquisition channel for low-consideration, low-urgency categories. A B2B software brand running rideshare in isolation, with no other touchpoint reinforcing the message, will likely see weak recall. Rideshare performs best as reinforcement, not as the entire campaign.
What Creative and Timing Work Best for Captive Riders?
Riders are stuck, phone in hand, for several minutes with nowhere to look but the screen in front of them. That’s a gift if your creative respects it and a wasted flight if it doesn’t.
Keep copy short. Riders don’t read paragraphs in a moving car. A single headline, one clear offer, and one CTA outperform anything busier. Uber’s own research found 95% of riders are open to seeing ads and 80% say ads catch their attention, but that receptivity evaporates fast if the message is cluttered.
- Lead with a QR code tied to an instant-value landing page, not a generic homepage
- Match daypart to intent: late-night rides get entertainment and food offers, daytime rides get convenience and service offers
- Use video for in-vehicle screens where sound or motion holds attention longer; use static creative for exterior wraps, where a glance is all you get
- Avoid middling copy lengths. Ultra-short offers and slightly longer, context-aligned ones both outperform anything in between
Pro Tip: Test two QR destinations against each other in the same flight. A landing page offering an instant discount code almost always beats one that just says “learn more.”
How Do You Calculate Rideshare Advertising ROI?
Run the math before you commit real budget, using conservative and optimistic scenarios side by side.
- Start with impressions. A $3,000 monthly budget at $20 CPM (mid-range in-vehicle screens) buys roughly 150,000 impressions.
- Apply a scan or engagement rate. Conservative campaigns might see 0.3% of riders scan a QR code; optimistic, well-targeted campaigns might hit 0.8%. That’s 450 to 1,200 scans.
- Apply a conversion rate off scans. At a conservative 10% and optimistic 25% conversion rate, you land between 45 and 300 conversions.
- Compare against your average order value to get estimated ROAS, then decide if the range clears your target.
Statistic Callout: Even the conservative end of that range, 45 conversions from a $3,000 flight, can clear breakeven fast for categories with high order values, like hospitality or ticketed events.
Budget at least several thousand dollars per month and run a minimum of four weeks before drawing conclusions. Highfloor’s 2026 playbook recommends single-market pilots specifically so you’re not scaling on noisy data. Before scaling, confirm you have impression logs, proof-of-posting documentation, and a measurement plan in place. Pause if scan rates fall well below the conservative floor after two weeks; scale if you clear the optimistic range with room to spare.

Beacon’s Approach to Measurable Rideshare Campaigns
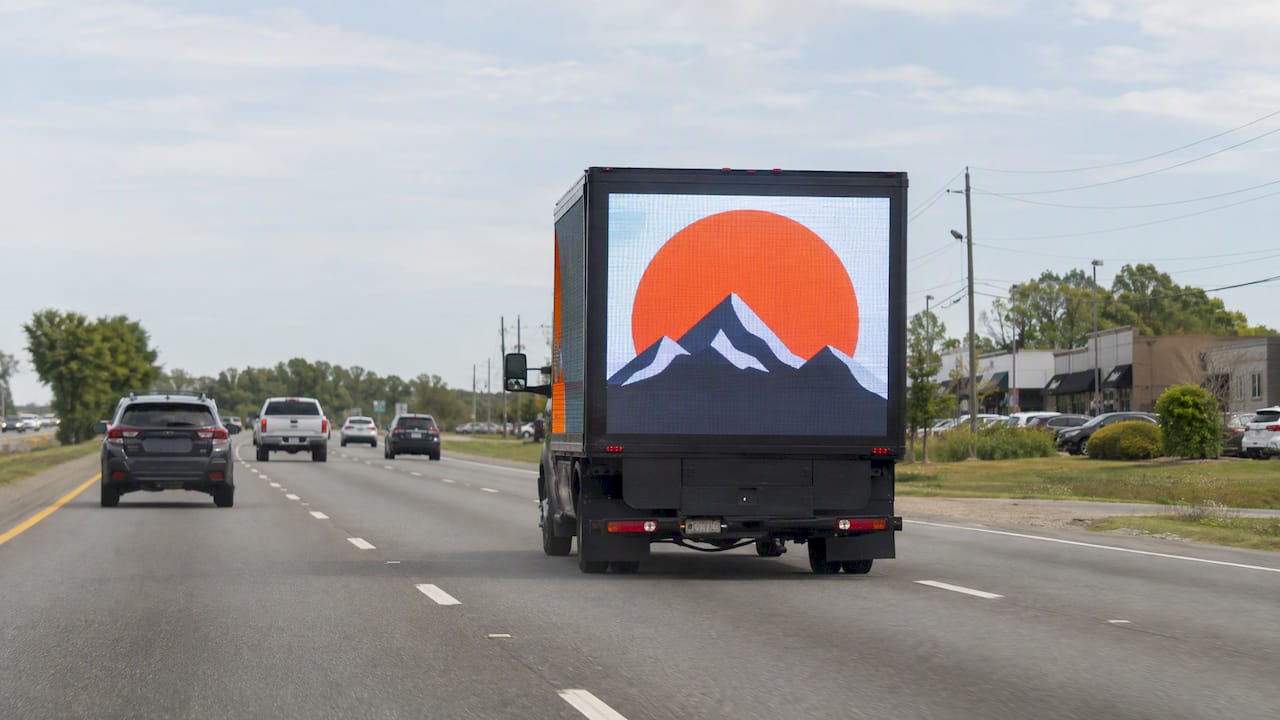
Rideshare works best as one layer in a coordinated plan, not a standalone bet. Beacon Mobile Media builds campaigns that pair wrapped rideshare vehicles and LED mobile billboards with real-time retargeting, geofencing, and attribution analytics so every flight generates funnel metrics instead of just impressions. Smart QR capture and proof-of-posting documentation turn a moving vehicle into a channel you can actually report on, and that reporting discipline is what separates a rideshare test that scales from one that dies in a single quarter.
— Scott
Start a Measured Rideshare Pilot With Beacon
Most rideshare vendors will quote you a CPM and call it a day. Beacon-ads builds the measurement into the quote itself, so you’re not left guessing whether your flight actually moved anyone.

Before you request a quote, know what to ask for: vehicle counts by market, a reporting cadence (weekly or per-flight), the specific attribution approach (brand lift, footfall panel, or conversion tracking), and proof-of-posting deliverables with GPS timestamps and photos. Beacon-ads includes smart QR capture and full attribution analytics as standard, not an add-on you negotiate for later. If you want to see how the format fits into a broader out-of-home plan first, start with the out-of-home advertising guide and request a pilot quote for your market from there.