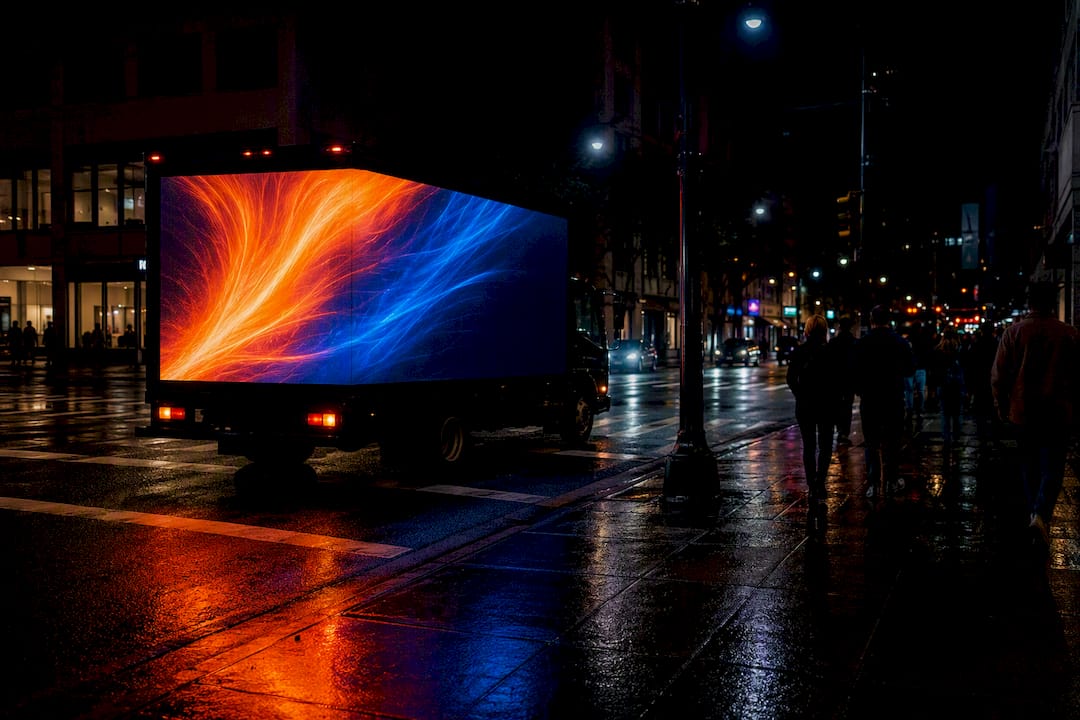
Rideshare advertising costs run from roughly $4 to $6 CPM for exterior car-top displays up to $10 to $25 CPM for in-vehicle screens, with vehicle wraps priced at $300 to $1,500 per vehicle monthly. Most markets require a minimum monthly commitment of $1,000 to $1,500 per format. Some companies package these formats with proof-of-posting and attribution reporting, so the quote you get already accounts for measurement, not just placement.
TL;DR:
- Rideshare advertising costs vary significantly by format, with car-top displays costing $4 to $6 CPM and in-vehicle screens ranging from $10 to $25 CPM.
- Vehicle wraps can cost $300 to $1,500 per vehicle monthly and typically require a minimum fleet of five to ten vehicles for effective campaigns.
- Budgets of $1,500 to $3,000 monthly are suitable for testing awareness in a single market, while larger budgets up to $40,000 support multi-market layered campaigns.
- Pricing models include CPM for car-top and screens, per-ride completed views at $0.05 to $0.15, and per-vehicle monthly rates for wraps.
- Geographical differences can double costs in top cities compared to secondary markets, influenced by vehicle density, local labor, and market size.
Table of Contents
- How Much Does Rideshare Advertising Cost by Format?
- What Are Realistic Sample Budgets for a Rideshare Campaign?
- How Is Rideshare Advertising Pricing Actually Calculated?
- How Do You Set a Rideshare Ad Budget?
- What Do Production and Installation Actually Cost?
- How Do You Measure Rideshare Advertising ROI?
- What Can Beacon Mobile Media Actually Deliver?
- Why Does Rideshare Advertising Cost More in Some Markets?
- When Should You Actually Test Rideshare Ads?
- How Do You Get Started With Beacon Mobile Media?
- Sources
How Much Does Rideshare Advertising Cost by Format?
Rideshare advertising pricing splits into four distinct formats, and each one carries a different cost structure because each one demands something different from the vehicle and the driver.
Exterior car-top displays, the illuminated toppers you see on Uber and Lyft vehicles, are the cheapest entry point. Digital and programmatic car-top inventory commonly runs $4 to $6 CPM, with monthly minimums typically starting around $1,000 to $1,500 per market. That low CPM comes with a tradeoff: toppers deliver broad reach to pedestrians and other drivers, but attention quality is passive.
In-vehicle screens flip that equation. These tablet-style displays mounted in the back seat put your creative directly in front of a captive passenger, and pricing reflects that. In-vehicle screen CPMs typically land in the $10 to $25 range, with most platforms requiring roughly $1,000 or more per month to activate a market.
Vehicle wraps, full or partial, work on a different pricing logic entirely: per-vehicle, per-month, rather than per-impression. Expect $300 to $1,500 per vehicle monthly, depending on wrap coverage and market cost of living. Most wrap campaigns require a minimum fleet of 5 to 10 vehicles to look like a coordinated buy rather than a single decorated car.
Interior placements, headrest cards, door panel decals, and QR-coded seatback signage, sit at the lowest absolute cost but the smallest reach per vehicle. Pricing here is usually bundled into the wrap or screen contract rather than sold standalone.
A few variables move every one of these numbers:
- Market size: Top-10 metro rates run higher than secondary markets for identical formats.
- Daypart: Premium windows, weekend nights, event periods, carry higher CPMs than standard weekday circulation.
- Fleet exclusivity: Locking a driver fleet to your brand costs more than a shared rotation.
- Contract length: Longer flights typically earn a lower blended rate than month-to-month buys.
What Are Realistic Sample Budgets for a Rideshare Campaign?
Turning CPM math into an actual dollar figure is where most marketers get stuck. Here’s how three common budget tiers shake out.
- Entry-level, single-market awareness ($1,500 to $3,000/month). This typically buys a car-top program at $4 to $6 CPM in one metro, generating hundreds of thousands of gross impressions monthly. It’s the right tier for testing whether rideshare visibility moves brand awareness before committing further.
- Mid-level, targeted response ($5,000 to $10,000/month). Blending in-vehicle screens with a smaller wrap fleet (5 to 8 vehicles) gives you both passive reach and captive-audience impressions. Expect measurable QR scan activity and completed-view data within the first 30 days, since per-ride completed-view pricing generally runs $0.05 to $0.15 per view.
- Multi-market, layered campaign ($20,000 to $40,000/month). This tier runs wraps, toppers, and in-vehicle screens across two or three metros simultaneously, layered with geofence retargeting. At this scale, attribution reporting stops being a nice-to-have and becomes the only way to know which format and market is actually driving results.
A campaign reaching 50,000 completed rides in a top-10 market might cost roughly $2,500 to $7,500 on a per-ride basis alone, before adding wrap or topper spend. That’s a useful anchor when a vendor quote feels either too cheap or suspiciously high.
How Is Rideshare Advertising Pricing Actually Calculated?
Three billing models dominate this category, and knowing which one you’re being quoted matters more than the headline number.
CPM (cost per thousand impressions) applies mostly to car-top and screen inventory. It’s calculated the same way as any out-of-home CPM: total media cost divided by estimated impressions, times 1,000. Per-ride completed-view pricing charges you only when a passenger’s ride includes a full screen play, typically $0.05 to $0.15 per completed view. Per-vehicle monthly rates apply to wraps, where you’re paying for the vehicle’s presence on the road regardless of how many impressions it technically generates.
Most vendor quotes include creative delivery specs, campaign reporting, and proof-of-posting documentation as standard. Add-ons that often cost extra:
- Rush creative production or last-minute wrap changes
- Exclusivity within a fleet or market
- Custom geofence zones beyond the standard radius
- Mid-campaign creative swaps
Guaranteed impression buys tend to raise your effective CPM compared to programmatic, non-guaranteed inventory, since programmatic car-top networks let smaller advertisers buy in at lower friction and lower committed volume.
Pro Tip: Ask for a rate reduction in exchange for a longer flight commitment before you ask for a rate reduction on volume. Vendors typically have more room to move on flight length than on per-unit price, especially for wraps.
How Do You Set a Rideshare Ad Budget?
Building a rideshare budget works backward from your goal, not forward from a number you feel comfortable spending.
- Define the outcome you need. Brand awareness needs impressions; lead generation needs QR scans or landing page visits; foot traffic needs geofenced visit lift.
- Convert that outcome into a volume target. If you need 500,000 impressions in a metro, car-top CPMs put that around $2,000 to $3,000 at the low end.
- Select the format mix. Awareness-only goals lean toward toppers; response goals lean toward screens and QR-enabled wraps.
- Build in a measurement plan before spending a dollar. Decide now whether you’re tracking scans, geofence lift, or proof-of-posting counts, because retrofitting attribution mid-campaign rarely works cleanly.
A realistic entry scenario: $2,000/month in one market for 60 days to validate response rates before scaling to a second metro. A mid-tier scenario: $7,500/month blending wraps and screens, run for a full quarter to smooth out weekly ride-volume variance. Combining formats, rather than betting everything on one, tends to outperform single-format buys because toppers and wraps build passive familiarity while screens and QR codes convert it.
Run any rideshare test for at least 30 days, and ideally 60 to 90, before judging results. Ride volume and passenger behavior swing enough week to week that a two-week test tells you very little. For a deeper look at how these timelines connect to actual return, the ROI breakdown for rideshare campaigns walks through the math in more detail.

What Do Production and Installation Actually Cost?
Media spend is only part of the invoice. Wraps and toppers both carry one-time production costs on top of the monthly media rate.
- Full vehicle wrap production, install, and removal typically adds a flat per-vehicle fee on top of the monthly rate, with partial wraps costing less than full coverage.
- Car-top hardware rental and maintenance is usually bundled into the monthly topper rate rather than billed separately.
- In-vehicle screen creative production (video editing, QR integration) is often a one-time fee per creative asset, reused across the flight.
- Lead times matter: wrap production and install commonly need one to two weeks of notice, and rush requests can carry a premium.
Removal logistics deserve their own line item in your budget planning, since a poorly coordinated wrap removal can extend your effective campaign cost. Beacon-ads covers this directly in its rideshare wrap removal guide.
How Do You Measure Rideshare Advertising ROI?
The KPIs that matter here are impressions, completed ride views, cost per thousand (CPM), QR scan volume, and visit lift inside your geofenced radius. Each maps to a different stage of the funnel, so track more than one.
Attribution runs through a few concrete mechanisms:
- Proof-of-posting, GPS and photo documentation confirming your creative was actually live on the vehicle.
- Geofence lift measurement, comparing foot traffic or visits inside your target radius against a control period.
- Retargeting and conversion tracking, following QR scans or ad exposure through to a landing page action.
Completed-view rates on in-vehicle screens commonly run $0.05 to $0.15 per view, a useful comparison point against digital video CPMs when you’re deciding where marginal dollars go next.
Run reporting on a weekly cadence internally, but reserve judgment on the campaign itself for 30 to 90 days. Rideshare ride patterns fluctuate with weather, events, and even gas prices, so short windows produce noisy data. For a broader framework on interpreting lift and conversion signals across channels, see this guide to tracking advertising ROI.
What Can Beacon Mobile Media Actually Deliver?
Some providers run LED mobile billboards and wrapped rideshare vehicles across Uber and Lyft fleets nationwide, paired with digital targeting layers that many rideshare vendors do not offer.
- Real-time retargeting and geofencing that follow the vehicle’s actual route, not a fixed estimate.
- Smart QR codes built into wraps and screens that capture scan data directly, feeding lead generation rather than just brand recall.
- Proof-of-posting documentation with GPS and photo evidence, so you’re not taking a vendor’s word for placement.
- Attribution analytics and funnel metrics that connect impressions to downstream action.
That combination matters most at procurement time. When proof-of-posting and attribution are built into the campaign rather than sold as an upsell, the risk of paying for placements you can’t verify drops considerably.
Why Does Rideshare Advertising Cost More in Some Markets?
Geography is the single biggest swing factor in any rideshare quote, and it works in ways that surprise a lot of first-time buyers.
Top-10 metros, New York, Los Angeles, Chicago, San Francisco, command higher rates across every format simply because rideshare vehicle density and rider volume are higher there. A car-top campaign in Manhattan can easily run double the CPM of the same format in a secondary market like Cincinnati or Tulsa, because the vendor is pricing against local vehicle availability, not just impressions.

Vendor rate tables commonly quote per-display pricing on a 4-week cycle rather than a calendar month, and that cycle length itself varies by market depending on how the local fleet is organized. Markets with fewer available branded vehicles tend to carry higher minimum spends, since the vendor needs to hit a baseline fleet size to make the campaign statistically meaningful.
Secondary and tertiary markets offer a genuine cost advantage for budget-conscious marketers, often 20 to 40 percent below top-metro rates for identical formats, but they come with a tradeoff in raw impression volume. A regional retailer or a business targeting a specific metro won’t lose much here. A national brand chasing broad reach will need to budget for the premium markets regardless.
Local labor and fuel costs also factor into wrap production quotes, since install and removal labor rates vary by region the same way any physical service does. A wrap that costs $400 to install in a mid-size Midwestern city might run closer to $600 in a coastal metro with higher labor costs.
When Should You Actually Test Rideshare Ads?
Rideshare formats earn their keep when your goal involves hyperlocal reach, event-driven timing, or a geofenced radius around specific venues. If you’re chasing broad national awareness, traditional digital or linear channels probably still win on cost efficiency. If you need to own a neighborhood, a conference district, or a metro corridor for 30 to 60 days, rideshare vehicles do something static billboards can’t: they move with the traffic pattern instead of sitting still.
My recommended first test: one market, one format (car-top or a small wrap fleet), $2,000 to $3,000 for 60 days, with QR scans and geofence lift as your only two KPIs. Resist the urge to layer formats before you’ve confirmed the audience responds at all.
— Scott
How Do You Get Started With Beacon Mobile Media?
Some vendors provide a direct route to measurable rideshare campaigns without needing to piece together toppers, wraps, and reporting from separate sources. These offerings can include LED mobile billboards and wrapped Uber and Lyft vehicles nationwide, with geofencing, retargeting, and smart QR data capture included rather than quoted as extras.

Before you commit budget, ask for three things: a sample proof-of-posting report, current attribution metrics from a comparable campaign, and a proposed route plan for your target geofence. Those three items tell you more about what you’re actually buying than any CPM sheet. Start by reviewing the full range of formats in this out-of-home advertising guide and request a campaign plan built around your market and budget tier.
Sources
- Rideshare Advertising on Uber and Lyft: A Complete Breakdown
- Taxi and Rideshare (Uber/Lyft) Advertising in 50+ Cities – Blue Line Media