
Out-of-home advertising just crossed a milestone most marketing managers haven’t fully absorbed yet. OOH revenue hit $9.46 billion in 2025, with digital OOH accounting for 36.3% of that total and posting 10.5% year-over-year growth. The assumption that billboards and transit ads can’t be measured like digital channels is outdated. Today’s OOH campaigns use geolocation signals, mobile device IDs, and purchase data to track real-world behavior with a precision that rivals paid search. This guide walks you through exactly how that works, what frameworks govern measurement, and how leading brands are using data to drive serious business outcomes.
Table of Contents
- How data is reshaping out-of-home advertising
- Measurement frameworks and standards for OOH campaigns
- Applying data-driven strategies: Real-world OOH campaign examples
- Privacy, challenges, and evolving best practices in OOH data
- Why true OOH innovation hinges on data maturity, not just technology
- Advance your OOH with data-driven expertise
- Frequently asked questions
Key Takeaways
| Point | Details |
|---|---|
| Data transforms OOH impact | Modern OOH campaigns leverage geolocation and purchase data for measurable business results. |
| Reliable measurement frameworks | Industry standards like Geopath and OAAA enable credible attribution and campaign optimization. |
| Privacy-first data strategies | Anonymized, aggregated data and compliant targeting protect consumer privacy in OOH. |
| Evidence-based campaign wins | Data-driven campaigns have proven lifts in arrivals, sales, and ROI across brands. |
| Innovation from data maturity | Sophisticated data application—not just technology—drives competitive advantage in OOH. |
How data is reshaping out-of-home advertising
With revenue hitting record highs, it’s worth understanding exactly what new data sources are making this possible. The short answer is that mobile devices changed everything. Nearly every consumer carries a GPS-enabled phone, which means that exposure to an outdoor ad can now be connected to what that person does next, whether they walk into a store, visit a website, or complete a purchase.
The three primary data types powering modern OOH measurement are geolocation data, mobile IDs, and point-of-sale purchase data. Geolocation data captures where a device travels over time, allowing analysts to identify which consumers passed a specific billboard location and when. Mobile IDs act as anonymous identifiers that can be matched across datasets without revealing personal information. Point-of-sale data closes the loop by connecting ad exposure to actual transactions. When these three inputs are layered together, data’s impact on OOH campaigns becomes measurable in ways that were simply not possible five years ago.
How layered attribution works in practice
The standard methodology compares two groups: an exposed group (consumers whose devices were detected near OOH placements) and a control group (similar consumers who were not). Differences in behavior between these groups, such as store visits, website sessions, or purchases, are attributed to the OOH campaign. Geolocation data, mobile IDs, and point-of-sale purchase data are applied in layered attribution methodologies to measure OOH impact on foot traffic, sales lift, and consumer behavior through these exposed versus control group comparisons.
Here are the core data inputs most campaigns rely on:
- Geolocation data: Continuous GPS or cell-tower signals from opted-in mobile devices
- Mobile device IDs: Anonymous identifiers (IDFAs and AAIDs) that allow cross-dataset matching
- Point-of-sale data: Transaction records from retail partners or loyalty programs
- First-party data: CRM lists and email match rates that connect online identity to physical movement
- Foot traffic panels: Aggregated store-visit data from third-party measurement providers
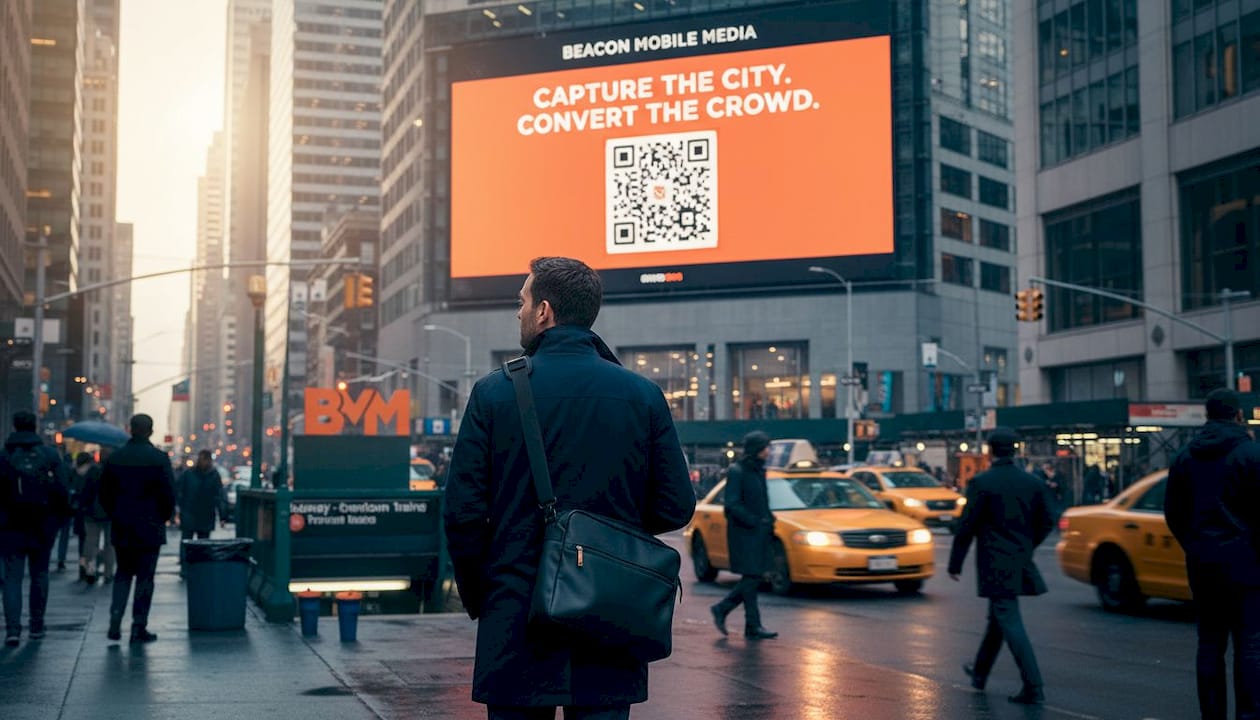
Understanding smart data capture in OOH is just as important as the technology delivering impressions. QR codes embedded in campaigns, for example, offer a direct data capture mechanism, creating a link between a physical exposure and a specific digital action.
| Data type | What it measures | Best use case |
|---|---|---|
| Geolocation | Physical proximity to ad unit | Foot traffic attribution |
| Mobile ID matching | Cross-channel audience behavior | Retargeting and frequency capping |
| Point-of-sale | Purchase behavior post-exposure | Sales lift studies |
| Brand lift surveys | Recall, sentiment, intent shifts | Awareness and consideration metrics |
| QR code scans | Direct engagement and lead capture | Lead generation and web traffic |

Using analytics for campaign measurement alongside OOH data means you’re not treating physical and digital as separate silos. The most effective campaigns integrate both, using digital engagement signals to validate what the physical exposure generated.
Measurement frameworks and standards for OOH campaigns
Once the right data is identified, the next step is understanding how it is applied and governed by industry standards. The OOH industry has built a credible measurement infrastructure, and knowing what governs the numbers you receive from vendors matters enormously.
The three primary methods used today are:
- Geo-fencing for foot traffic attribution: A virtual boundary is drawn around a location. Devices that enter the boundary after being exposed to an OOH unit are counted as conversions.
- Brand lift surveys: A panel of exposed and unexposed consumers is surveyed to measure shifts in awareness, recall, and purchase intent.
- Marketing mix modeling (MMM): Statistical modeling that isolates OOH’s contribution to sales alongside other media inputs like paid social, TV, and search.
- Test and control market comparisons: OOH runs in select markets while comparable markets receive no OOH, and outcomes are compared across both.
- Viewable impression standards: Industry bodies define what counts as a “seen” impression based on audience proximity, panel size, and likelihood-to-see scores.
Measurement methods including geo-fencing, brand lift surveys, test/control markets, and MMM are now paired with formal standards from Geopath, OAAA, and the Media Rating Council (MRC) for viewable impressions and likelihood-to-see metrics. These bodies set the rules that vendors must follow to claim accreditation, which protects you as a buyer.
Industry standards at a glance

| Organization | Primary role | Key metric governed |
|---|---|---|
| Geopath | Audience measurement for OOH | Weekly impressions, reach, frequency |
| OAAA | Industry trade association and advocacy | Campaign reporting standards |
| MRC | Audits and accredits measurement methods | Viewable impression definitions |
| Ipsos (pilot) | Independent research for next-gen metrics | Credible reach and frequency data |
The Geopath and OAAA standards framework is actively evolving. The industry’s next-generation measurement pilot with Geopath, OAAA, and Ipsos is advancing standardized impressions, reach, and frequency metrics that will bring OOH reporting closer to the rigor of digital media buying. For marketing managers accustomed to demanding accountability from every channel, this is a significant development.
Pro Tip: When reviewing OOH vendor reports, always ask whether their impression counts are based on MRC-accredited methodology or proprietary estimates. Non-accredited figures can overcount by a wide margin, particularly in low-traffic locations, and that gap directly inflates your perceived reach while understating your true cost per thousand.
Digital targeting strategies that integrate with these measurement frameworks give you far more than exposure counts. They give you behavioral proof that your message reached the right people at the right time.
Applying data-driven strategies: Real-world OOH campaign examples
Now that frameworks are established, let’s see them in action through data-powered OOH campaigns. These aren’t hypothetical scenarios. They’re measured results from brands that treated OOH the way performance marketers treat paid digital.
Visit Arizona used programmatic digital OOH to target travel-intent audiences across key feeder markets. By combining audience data with dynamic creative tied to seasonal travel patterns, the campaign drove a 30% increase in arrivals, with HP achieving a 12% sales lift and 42% purchase consideration increase, and Lemma’s Integral AI platform delivering 1.5x app installs and 3x ROAS compared to baseline. These numbers represent what happens when you treat OOH as a data asset, not just a visibility tactic.
Here’s a summary of the measurable outcomes across these campaigns:
- Visit Arizona: 30% increase in travel arrivals from target markets
- HP: 12% sales lift and 42% increase in purchase consideration
- Lemma Integral AI: 1.5x improvement in app installs and 3x return on ad spend
- Foot traffic benchmarks: Data-driven DOOH campaigns consistently outperform static formats on cost-per-visit metrics
- Cross-channel lift: Brands pairing DOOH with mobile retargeting report significantly higher unaided recall
“Digital out-of-home isn’t just about visibility anymore. When you layer audience data, dynamic creative, and attribution modeling together, it performs like a performance marketing channel with the scale of mass media.”
The proven DOOH strategies behind these results share a common structure. Each started with a clearly defined audience segment, used geofenced delivery to control where impressions landed, and connected those impressions to a measurable downstream action.
Localized targeting for effectiveness is particularly powerful here. Rather than blanketing a city with a single message, data-driven OOH lets you concentrate impressions near competitor locations, event venues, or neighborhoods where your highest-value customers already live. The SEO case studies for campaign ROI parallel here is instructive: narrow targeting with strong intent signals almost always outperforms broad reach with weak relevance.
What’s striking about these case studies is the specificity of measurement. Traditional OOH measurement stopped at estimated impressions. Data-driven campaigns now produce lift reports, conversion attribution, and ROAS figures that belong in the same conversation as your paid search dashboard.
Privacy, challenges, and evolving best practices in OOH data
Powerful results require care around privacy and operational realities. The same data infrastructure that enables precise measurement also creates regulatory and reputational risk if handled incorrectly.
Privacy laws like GDPR in Europe and CCPA in California have reshaped how audience data can be collected, stored, and used. Even though OOH advertising doesn’t directly collect personal information from viewers, the mobile data pipelines that feed attribution platforms are subject to these regulations. Any vendor claiming to use device-level data for OOH measurement should be able to explain how that data was consented, anonymized, and aggregated before it reaches your campaign.
Here are the key practices that reduce risk while preserving measurement quality:
- Anonymized and aggregated data: No campaign should rely on individual-level tracking. Cohort-based approaches group users by behavioral attributes without identifying anyone personally.
- Contextual data as a fallback: When device-level signals aren’t available, contextual signals (time of day, location category, weather conditions) preserve targeting quality without privacy exposure.
- First-party data partnerships: Working with retailers or loyalty programs that have explicit consent allows you to connect OOH exposure to purchase behavior legitimately.
- Avoiding facial recognition: Despite its technological appeal, facial recognition in OOH contexts carries significant backlash risk and regulatory uncertainty. Reputable campaigns don’t use it.
- Vendor auditing: Ask your OOH technology partners to document their data provenance and privacy compliance policies before signing any contract.
GDPR and CCPA compliance in OOH isn’t just a legal checkbox. It’s increasingly a competitive differentiator. Brands that handle audience data responsibly build consumer trust, and that trust compounds over time into stronger brand equity.
There are also technical and operational challenges worth acknowledging. Attribution windows can be misaligned with actual purchase cycles. Foot traffic data has accuracy limitations depending on the measurement provider. And in high-density urban environments, device signals can be messy, with consumers passing multiple OOH units in a short window, making clean attribution harder.
Pro Tip: Set your attribution window based on your actual purchase cycle, not the vendor’s default. A fast-food brand might use a 24-hour window, while a car dealership might need 90 days. Mismatched windows lead to either over-crediting or under-crediting OOH, both of which distort your media mix decisions.
Cost efficiency is another real challenge. Data-enhanced OOH inventory typically carries a premium over standard placements. The key is tying that premium to measurable outcomes rather than just richer targeting options. If you can’t connect the additional spend to an improvement in cost-per-acquisition or ROAS, the premium isn’t justified.
Why true OOH innovation hinges on data maturity, not just technology
Here’s the view we’ve developed working with brands across diverse markets and campaign types: the organizations consistently generating strong OOH results aren’t necessarily those with the largest budgets or the most sophisticated ad tech stack. They’re the ones that have built genuine data maturity inside their marketing organizations.
Data maturity means more than running attribution reports. It means asking the right questions before a campaign launches: What behavioral signals define our target audience? What downstream action are we attributing to this channel? How will we separate OOH’s contribution from the other media running simultaneously? These questions sound simple, but most teams skip them in the rush to execution.
The measurement improvements happening across the OOH industry, particularly the advances in data capture and OOH results, matter far more than whether a particular vendor has the newest LED display technology. A beautifully executed creative on a state-of-the-art LED truck generates zero actionable intelligence if there’s no measurement framework attached to it.
Privacy culture is also a genuine competitive advantage, not just a compliance burden. Brands that proactively adopt transparent data practices are positioning themselves ahead of a regulatory trajectory that is clearly heading toward stricter standards. Building that culture now, when the pressure is moderate, is easier than scrambling to comply under enforcement pressure later.
The uncomfortable truth about OOH data strategies is that most underperformance traces back to measurement gaps, not creative quality or placement decisions. When brands can’t clearly articulate what success looks like in measurable terms, campaigns get evaluated on gut feel rather than performance data. That leads to budget misallocation and missed optimization opportunities. Deeper data application, not higher spend, is what drives competitive impact.
Advance your OOH with data-driven expertise
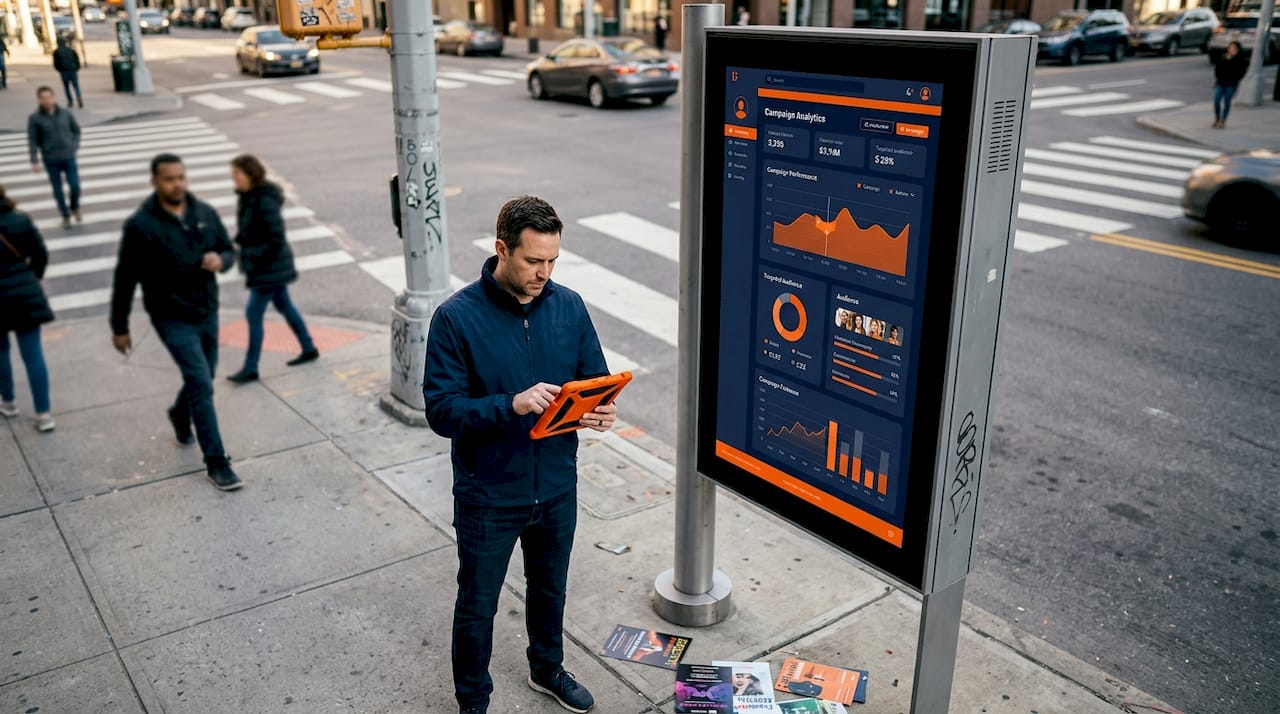
At Beacon Mobile Media, we’ve built our entire platform around the idea that OOH advertising should be as measurable as any digital channel. Our LED mobile billboards and wrapped rideshare vehicles don’t just generate impressions; they generate attribution data, QR scan events, geofenced retargeting audiences, and proof-of-posting documentation that goes directly into your reporting stack.
![]()
If you’re ready to put data to work in your next OOH campaign, explore our strategy guide for data-driven OOH for a structured approach to campaign planning, or review the digital OOH proven impact section to see how the methodology translates to real business outcomes. For tactical execution, our expert OOH tips resource covers the specific steps that separate high-performing campaigns from campaigns that just run. Our team is ready to build a data-backed OOH strategy designed for your market, your audience, and your measurable goals.
Frequently asked questions
How can geolocation data enhance OOH advertising?
Geolocation data lets you target audiences with greater precision by identifying consumers who physically move through specific areas, and then track whether those consumers visited your location or converted after exposure. Geolocation data, mobile IDs, and point-of-sale data are applied in layered attribution models to directly measure OOH impact on foot traffic and sales.
What industry standards govern OOH campaign measurement?
Geopath sets audience measurement standards, the MRC accredits viewable impression methodologies, and the OAAA governs reporting practices across the industry. Geo-fencing, brand lift surveys, and MMM are the core measurement methods these standards apply to.
How do brands address privacy concerns in OOH data strategies?
Brands use anonymized, aggregated device data and cohort-based targeting to comply with GDPR and CCPA without tracking individuals. Avoiding facial recognition and prioritizing contextual and environmental data protects brands from both regulatory risk and consumer backlash.
Can data-driven OOH campaigns be used for localized marketing?
Absolutely. Geofencing and audience segmentation allow you to deploy OOH in specific neighborhoods, trade areas, or near competitor locations, and then compare conversion rates across markets. Geo-fencing for foot traffic attribution is particularly effective for hyperlocal campaign comparisons.
What results can businesses expect from data-powered OOH campaigns?
Results vary by industry and execution quality, but benchmarks are compelling. Data-driven DOOH campaigns have delivered 30% increases in arrivals, 12% sales lifts, 42% purchase consideration gains, and 3x ROAS improvements compared to non-data-driven baselines.


