Outdoor ad performance measurement is the process of quantifying how outdoor advertising campaigns generate audience engagement and business outcomes using attribution models, intent signals, and analytics. The industry term for this discipline is out-of-home (OOH) measurement, and it has moved well beyond counting impressions. Marketers now use lift-and-control experiments, marketing mix modeling (MMM), and footfall attribution to connect billboard exposure to real revenue. This guide covers every layer of that process, from setting KPIs before launch to interpreting results without falling into common attribution traps.
What are the key metrics and data signals for outdoor ad performance measurement?
Effective OOH measurement starts with three distinct signal types: exposure metrics, intent signals, and outcome signals. Each layer tells a different part of the story, and relying on only one produces an incomplete picture.
Exposure metrics
Impressions, reach, frequency, and CPM form the baseline of any outdoor advertising analytics report. Impressions count total ad views based on traffic and audience panel data. Reach measures unique individuals exposed, while frequency tracks how many times each person sees the ad. CPM (cost per thousand impressions) normalizes cost across formats. These numbers confirm delivery but say nothing about whether the ad changed behavior.

Intent signals
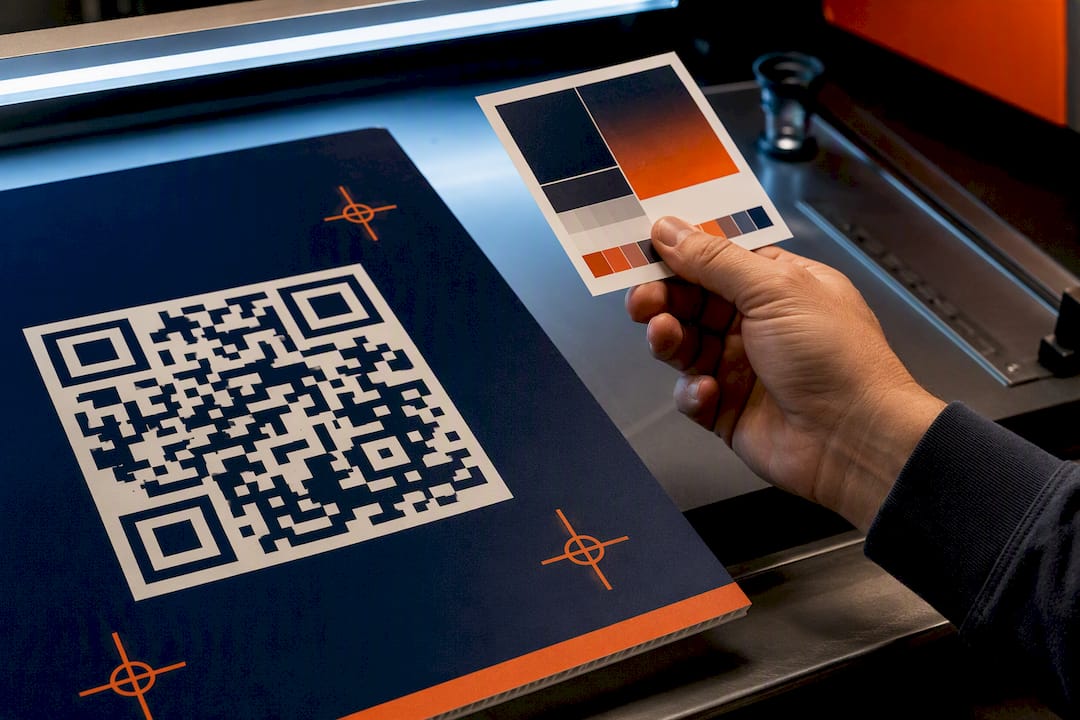
Branded search lift is one of the strongest intent signals available for OOH campaigns. It measures the increase in branded search volume in exposed markets versus matched control markets during the campaign flight. Additional intent signals include direct website visits, map searches, phone calls, and quote requests tied to regional exposure. Smart QR codes on mobile billboards and wrapped vehicles add a direct capture layer. Beacon-ads integrates QR code engagement into its campaigns specifically to create a traceable path from physical ad exposure to digital action.
Outcome signals
Outcome signals are where ad campaign performance becomes defensible to finance teams. Store foot traffic, sales lift, inbound calls, and lead generation all qualify. These require matching exposed audiences to behavioral data, which is why delivery proof matters so much. Without verified unit lists and flight dates for static OOH, or proof-of-play logs and screen IDs for digital OOH (DOOH), outcome data loses credibility fast.
| Metric category | Key metrics | Typical sources |
|---|---|---|
| Exposure | Impressions, reach, frequency, CPM | Audience panels, traffic counts |
| Intent | Branded search lift, map searches, QR scans | Search platforms, QR analytics |
| Outcome | Foot traffic, sales lift, calls, leads | Location data, CRM, call tracking |
| Delivery proof | Unit lists, flight dates, proof-of-play logs | Vendor reporting, DOOH logs |
Pro Tip: Set up a dedicated landing page or phone number for each outdoor campaign before it launches. This creates a clean, isolated capture path that no other channel can contaminate.

How do you design a rigorous outdoor ad measurement plan?
Measurement planning before campaign launch is the single most important step most marketers skip. Without it, you end up with data you cannot trust.
-
Define your primary KPI. Choose one outcome metric before launch: foot traffic lift, branded search lift, or sales lift. Secondary metrics can supplement, but one KPI keeps the analysis focused and prevents post-hoc rationalization.
-
Identify test and control markets. Select geographies with similar demographics, baseline traffic, and competitive activity. The control group must not receive the OOH exposure. This matched-pair structure is what separates a real lift measurement from a guess.
-
Protect your digital capture paths. Create dedicated URLs, landing pages, or phone numbers for the campaign. Tag QR codes with UTM parameters. Any shared URL or number will mix OOH-driven traffic with organic or paid search traffic, making attribution impossible.
-
Set your measurement window correctly. Measurement windows must cover the full campaign flight plus a tail period. OOH awareness often converts over weeks, not days. Typical windows include same-day, 7-day, and 30-day decayed visit counts. Cutting the window at campaign end systematically undercounts impact.
-
Integrate with marketing mix modeling. MMM captures the full revenue impact of OOH advertising, including halo effects and interactions with digital channels. Feed your OOH spend data into your MMM inputs alongside other channel spend. This is especially critical for OOH because there is no click data to rely on.
-
Collect delivery proof. Gather audited unit lists, flight confirmation dates, and photos before the campaign ends. For DOOH, collect proof-of-play logs with screen IDs. This documentation is the foundation of any credible outcome report.
Pro Tip: Build a 10–14 day tail period into every measurement window. Consumers who see a billboard on Monday may not visit your store or search your brand until the following weekend. Short windows miss this entirely.
What methods and tools measure outdoor ad performance effectively?
The most rigorous method for measuring ad reach and behavioral impact is the lift-and-control experiment. Lift-and-control experiments compare store visits between exposed and matched unexposed groups, adjusting for covariates like weather, local events, and competitor activity. Results typically appear within a 7-day window using regression modeling. This approach produces a statistically defensible lift number rather than a directional estimate.
Footfall attribution
Footfall attribution connects billboard exposure to physical store visits using mobile location data and in-store sensing. High-accuracy visit counters with non-invasive sensing can reach 90%+ accuracy while maintaining visitor privacy. The exposure model combines panel reach, frequency, and movement data to estimate which visitors were likely exposed to the ad. Granular hourly and door-level detail makes it possible to identify which dayparts and locations drive the most traffic.
Branded search and web traffic lift
Geo-matched control analysis measures branded search lift by comparing search volume trends in exposed versus unexposed markets. The same method applies to direct website traffic. This approach works well for campaigns running in distinct geographic markets, such as a city-level LED mobile billboard deployment. Beacon-ads campaigns across specific metro routes create natural geographic boundaries that make this analysis clean and reliable.
Marketing mix modeling
MMM uses historical spend inputs and observed revenue outcomes to isolate each channel’s contribution. It captures halo effects and multi-channel interactions that single-touch attribution misses entirely. For OOH specifically, MMM is often the only method that can quantify the revenue contribution of a campaign that ran with no clickable element.
Sanity checks and validation
Shuffled exposure variables and placebo cohorts are essential validation steps. A shuffled exposure test randomly reassigns exposure labels and reruns the model. If the model still finds lift, the result is noise, not signal. Placebo cohorts test whether unexposed groups show the same “lift” as exposed ones. Without these checks, attribution numbers can be inflated and misleading.
| Measurement approach | Best for | Key limitation |
|---|---|---|
| Lift-and-control experiment | Footfall, store visits | Requires matched control geography |
| Branded search lift | Intent and awareness | Needs sufficient search volume |
| Marketing mix modeling | Full revenue attribution | Requires historical data and time |
| QR code tracking | Direct response capture | Only reaches audiences who scan |
Pro Tip: Always run a placebo cohort before presenting lift results to stakeholders. If your placebo shows lift, your model has a problem. Fix the model before the meeting, not after.
How do you interpret results and optimize campaigns based on outdoor ad measurement?
Lift magnitude alone does not tell you whether a result is real. Confidence intervals matter just as much as the lift number itself. A 12% foot traffic lift with a wide confidence interval spanning 0% to 24% is not a reliable finding. A 6% lift with a tight interval of 4% to 8% is far more actionable.
Delayed effects are the most common source of underreported OOH impact. OOH awareness converts over weeks, so a report pulled at campaign end will always undercount. Extend your analysis window and compare 7-day versus 30-day results to see the tail effect in your specific category.
The most damaging mistake in outdoor advertising analytics is the pre/post analysis without a control group. Before-and-after comparisons without controls inflate lift results because external factors like seasonality, competitor promotions, and economic shifts affect both periods. True attribution requires matched control groups and regression modeling to isolate the campaign’s actual contribution.
Common mistakes to avoid:
- Running pre/post analyses without matched control markets
- Using shared URLs or phone numbers across multiple channels
- Cutting the measurement window at campaign end rather than extending into the tail
- Treating impressions as a proxy for outcomes without any behavioral signal
- Skipping delivery proof collection until after the campaign ends
Pro Tip: Benchmark your lift results against your own past campaigns before comparing to industry averages. Your category, geography, and creative quality all affect lift magnitude more than the format itself.
Once you have reliable results, feed them directly into budget allocation decisions. Integrating OOH into MMM alongside digital channels lets you compare cost-per-outcome across your full media mix. That comparison is what justifies increasing or reallocating OOH spend with confidence.
Key Takeaways
Effective outdoor ad performance measurement requires pre-launch planning, matched control groups, extended measurement windows, and delivery proof to produce results that are credible and actionable.
| Point | Details |
|---|---|
| Plan before launch | Define KPIs, control markets, and capture paths before the campaign goes live. |
| Use layered signals | Combine exposure metrics, intent signals, and outcome data for a complete picture. |
| Extend measurement windows | Cover the full flight plus a tail period to capture delayed conversions. |
| Validate with sanity checks | Run shuffled exposure tests and placebo cohorts before presenting lift results. |
| Integrate with MMM | Feed OOH spend into marketing mix modeling to quantify full revenue contribution. |
What I’ve learned about measurement that most guides won’t tell you
Most marketers treat measurement as something you set up after the campaign brief is approved. That single habit is responsible for more wasted OOH budget than any creative or placement decision. By the time the campaign launches without a control market identified or a dedicated capture path in place, the data is already compromised.
The shift toward outcome-based measurement is real and accelerating. Industry leaders are moving away from reach and GRPs as primary success metrics toward foot traffic, sales lift, and branded search lift. That shift is correct, but it only works if the underlying data infrastructure is sound. Outcome metrics built on bad delivery proof or no control group are worse than impressions because they create false confidence.
Data quality and privacy deserve more attention than they get in most measurement guides. Footfall attribution that relies on mobile location data is only as good as the panel it draws from. Non-invasive in-store sensing that does not collect personally identifiable information produces cleaner, more defensible data than opt-in panels with selection bias. Know what your measurement vendor is actually counting before you trust the number.
The marketers who get the most out of OOH measurement are the ones who treat it as a continuous testing program, not a one-time report. They run the same campaign in two markets with different creative, measure both, and carry the winner forward. That discipline compounds over time. The first measurement is rarely the most valuable one. The fifth one, informed by four prior experiments, is where real optimization lives.
— Scott
Beacon-ads delivers OOH campaigns built for measurement from day one
Beacon-ads combines LED mobile billboards and wrapped rideshare vehicles with geofencing, real-time retargeting, and QR code capture across all 50 states. Every campaign includes proof-of-posting documentation and attribution analytics so you have the delivery proof your measurement plan requires.

Marketers who want to move beyond impressions can explore the full types of out-of-home advertising available through Beacon-ads, from mobile LED units to wrapped rideshare fleets. For teams building a full measurement framework, the data-driven OOH strategies guide covers how to align format selection with your KPIs and measurement approach. Beacon-ads is built for brands that need results they can prove.
FAQ
What is outdoor ad performance measurement?
Outdoor ad performance measurement is the process of quantifying how OOH campaigns drive audience behavior and business outcomes using attribution models, intent signals, and analytics. It covers everything from impressions and branded search lift to foot traffic and sales lift.
What metrics matter most for measuring billboard effectiveness?
Foot traffic lift, branded search lift, and sales lift are the most defensible outcome metrics for billboard campaigns. Impressions and reach confirm delivery but do not prove business impact on their own.
How do lift-and-control experiments work for OOH?
Lift-and-control experiments compare store visits or search behavior between exposed and matched unexposed groups, using regression modeling to adjust for external factors like weather and competitor activity. Results typically appear within a 7-day measurement window.
Why does the measurement window matter for outdoor advertising?
OOH awareness often converts over weeks rather than days, so short measurement windows systematically undercount campaign impact. Extending the window to cover the full flight plus a tail period captures delayed conversions that would otherwise be missed.
What is marketing mix modeling and why does OOH need it?
Marketing mix modeling (MMM) uses historical spend and revenue data to isolate each channel’s contribution to overall revenue, including halo effects. OOH lacks click data, making MMM one of the only methods that can quantify its full revenue impact within a multi-channel media mix.