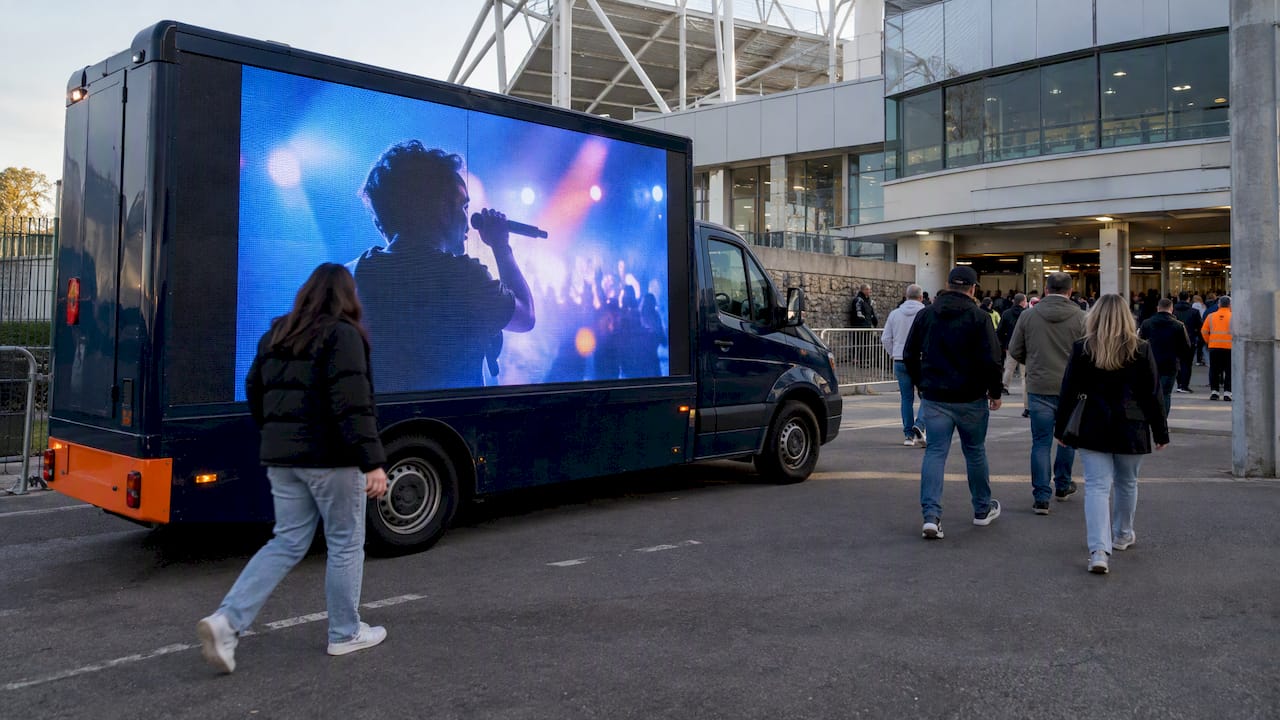
Out-of-home attribution models are the rules that decide how much credit a billboard, truck or wrapped car gets for a result such as a store visit, a website session or a sale. The five credit-splitting models are first-touch, last-touch, linear, time-decay and position-based. For OOH, though, the model is only half the answer. The method that proves the ad caused the result, usually a test-versus-control comparison, matters just as much. This guide covers both, so you can match the approach to your goal.
TL;DR
- Single-touch models give all credit to one touchpoint. Multi-touch models (linear, time-decay, position-based) split credit across several.
- OOH rarely works alone, so single-touch models usually understate or overstate it. Multi-touch or incrementality methods give a fairer picture.
- The standard OOH proof method is test versus control: exposed people compared with an unexposed group that mirrors them.
- Pick the metric that matches the campaign’s job. A traffic goal should be judged on visits, not sales.
- Set the attribution window before launch. Thirty days is typical, and longer windows suit long-consideration categories.
Table of Contents
- What OOH attribution measures
- The main attribution models and how each assigns credit
- Test versus control: the OOH-specific method
- Choosing the right model for your campaign goal
- Set the attribution window before you launch
- Limits every OOH attribution model shares
- Perspective: why mobile OOH is easier to attribute
- A simple way to put this into practice
- Plan a campaign you can measure
- FAQ
- Sources
What OOH attribution measures
Measurement and attribution are related but different jobs. Measurement counts things like impressions and reach. Attribution asks whether the campaign caused a behavior. The Outdoor Advertising Association of America (OAAA) describes OOH attribution as in-flight and post-campaign analytics that show causality or correlation between ad performance and consumer behavior, relative to the advertiser’s goals.
The key word is incremental. Good attribution isolates the people who acted because of exposure, not those who would have bought or visited anyway. The OAAA’s modeling guidance frames it as identifying how many consumers who performed a desired outcome, such as buying or visiting a store, are truly incremental to those who would have done so without seeing the campaign.
That is a higher bar than counting scans or clicks. It is also why the word “model” means two different things in OOH:
- Credit-allocation models decide how to divide credit among touchpoints in a customer journey.
- Causal or incrementality models estimate what would have happened without the ad.
Most searches for “OOH attribution models” mean the first. Most serious OOH proof relies on the second. You will usually want both.
The main attribution models and how each assigns credit
The OAAA’s digital OOH guidance groups approaches into single-touch attribution, which assigns all credit to one touchpoint, and multi-touch attribution, which allocates credit across multiple channels. The common named models sit under those two headings.
| Model | How credit is assigned | Best for | Weak spot for OOH |
|---|---|---|---|
| First-touch | All credit to the first recorded interaction | Awareness and discovery campaigns | Ignores everything that closed the sale |
| Last-touch | All credit to the final interaction before the result | Short, direct-response funnels | Gives a billboard almost nothing, because the last click is usually search or a direct visit |
| Linear | Equal credit to every touchpoint | Teams that want a neutral starting view | Treats a passing glance the same as a deliberate visit |
| Time-decay | More credit to touches closer to the result | Promotions with a clear deadline | Undervalues early awareness |
| Position-based (U-shaped) | Most credit to the first and last touches, the rest to the middle | Valuing discovery and closing together | The weighting is a convention you choose, not a measured fact |
First-touch and last-touch
Single-touch models are simple to run and easy to explain, which is why they persist. They are also the models most likely to mislead on OOH. The OAAA points out that consumers often meet several touchpoints before acting, so single-touch attribution may fail to represent the full decision journey.
A concrete example: someone sees a mobile billboard on the way to work, later searches the brand name, and buys after clicking a retargeted ad. Last-touch credits the retargeted ad. First-touch credits the billboard only if the billboard exposure was actually recorded as a touch. Neither tells you how much the billboard contributed to the search in the first place.

Linear, time-decay and position-based
Multi-touch models spread the credit. Linear splits it evenly. Time-decay weights recent touches more, so an ad seen the day before a purchase counts more than one seen three weeks earlier. Position-based gives the largest shares to the first and last interactions and a smaller share to everything between.
For OOH, each choice encodes a belief about what the medium does:
- If you think OOH mainly creates awareness, first-touch or position-based weighting reflects that.
- If you think it mainly reminds and nudges near the point of purchase, time-decay fits better.
- If you do not know yet, linear is a reasonable neutral baseline while you gather data.
The weights are assumptions. Treat them as a lens, and compare two or three lenses on the same campaign data rather than trusting one.
Custom and data-driven models
Some teams build custom models that weight touchpoints by observed behavior, such as giving a geofenced exposure near a store more credit than a general impression. The principle is the same: the model is only as good as the exposure data feeding it. If you are setting this up from scratch, our four-phase multi-touch attribution setup walks through the stages.
Test versus control: the OOH-specific method
Credit-allocation models tell you how to divide credit. They do not prove the ad worked. For that, OOH measurement leans on incrementality. The OAAA says the typical approach for single-channel OOH attribution is a test-versus-control methodology, comparing how often a behavior occurs in an exposed test group and in an unexposed control group. The difference is the lift.
What makes a control group valid
The OAAA’s modeling paper is specific here. A control group must be entirely unexposed, and it must mirror the test group in its propensity to perform the outcome, so that exposure to the campaign is the only significant difference. The same paper stresses that scale is essential for statistically significant estimates, and that incomplete campaign coverage must be representative and weighted or projected.
In practice that means:
- Compare like with like: similar neighborhoods, similar commuters, similar baseline behavior.
- Make sure the control area saw none of your OOH, including other formats.
- Run enough exposure volume that a small difference is not just noise.
Common outcome measures
The guidance lists several outcome types that can be tested this way: brand lift, foot-traffic attribution, online traffic, app downloads, social media impact and sales lift. A few examples of how they are measured for digital OOH:
- Website and conversion tracking: the IAB’s DOOH guide describes conversion pixels that track users who both viewed an ad and completed an online purchase, and geofencing plus mobile location data to connect exposure to store visits.
- Sales lift: comparing sales in exposed and unexposed areas to find incremental purchases, also covered in the IAB guide.
- Brand lift: proximity-based audience surveys that measure ad recall, awareness and intent.
For the store-visit side in detail, see our explainer on foot traffic attribution.
Choosing the right model for your campaign goal
Start from the job the campaign has to do. The OAAA’s advice is to align the metric with the campaign’s strategic role, for example focusing on retail traffic for traffic-driving goals rather than sales. A truck parked outside a trade show cannot reasonably be judged on revenue booked six months later.
| If your goal is… | Lead with | Add |
|---|---|---|
| Awareness in a new market | Brand lift, first-touch or position-based view | Reach and exposure reporting |
| Store or venue visits | Test-versus-control foot-traffic lift | Geofenced exposure data |
| Lead generation at an event | QR scan and form-fill counts, last-touch view | Linear view to see assisting touches |
| Online sales or signups | Conversion-pixel matching, time-decay view | Incremental sales lift by region |
| Long-consideration purchase | Longer window, multi-touch view | Sales lift against a matched region |
Two habits keep the choice honest. First, pick the model before launch, not after you see which one flatters the results. The OAAA recommends planning measurement requirements ideally before a campaign launches and weighing the cost of complex metrics against their value to buyers. Second, report at least two views side by side so stakeholders see the range.
Set the attribution window before you launch
The window is the period after a campaign ends in which outcomes still count, capturing the lingering effect of advertising. The OAAA’s modeling paper says 30 days is typical, while 90 days is common for automotive. Quick-purchase categories can sit near the short end. Cars, furniture and B2B software tend to need longer.
A window that is too short cuts off real results. One that is too long starts crediting your ad for purchases driven by something else. If you want a second take on choosing post-campaign windows for counting outcomes, compare it against your own sales cycle data and decide before the first impression runs.
Limits every OOH attribution model shares
Knowing the limits is what makes the numbers usable. The OAAA lists three that matter:
- Isolation is hard. Separating OOH from promotions, seasonality, TV, search and social takes careful design.
- Imbalanced groups misattribute. If test and control are not well matched, lift can be credited to the ad that belongs to the audience.
- Cross-media blind spots. Attribution models can be blind to influences from other media, per the OAAA modeling paper.
The practical response is design, not despair. Keep other media steady during a test where you can, document what else ran, and treat any single number as an estimate with a range.
Perspective: why mobile OOH is easier to attribute
We run LED mobile billboards and wrapped rideshare cars across all 50 states, and the biggest attribution problem we see is not the model. It is that static media gives you almost no control over exposure, so the test group and the control group are guesses.
Mobile changes that. When you choose the route, the neighborhood and the hours, you know where the ad was and where it was not. That is the raw material a clean test-versus-control comparison needs. Proof-of-posting with GPS and photo records tells you exposure really happened, and geofencing lets you tie that exposure to visits and retargeting audiences.
Smart QR codes add a second signal. A scan captures data directly, so you get a measured response from the street, not only a modeled one. We would still tell any marketer to run two views of the same campaign: a credit-allocation view for the journey and an incrementality view for proof.
Our approach is to agree on the goal, the metric and the window with the client before the first route runs. Everything after that is reporting against a plan, not a search for a flattering number.
Scott
A simple way to put this into practice
- Define the one job. Awareness, visits, leads or sales. Choose one primary outcome.
- Pick the metric that matches. Visits for a traffic goal, scans and form fills for an event, matched conversions for online sales.
- Choose test and control areas. Match them on baseline behavior and keep the control free of your other OOH.
- Fix the window. Use 30 days as a starting point and extend it for long-consideration categories.
- Capture exposure proof. GPS logs and photo records show where and when ads ran.
- Report two views. One credit-allocation model and one lift result, with the limits stated.
For related reading, our guides to OOH KPIs, measurable advertising strategies and why comprehensive attribution analytics drives ROI go deeper on each step.
Plan a campaign you can measure
If you want mobile OOH built around a measurement plan, Beacon Mobile Media combines LED mobile billboards and wrapped rideshare vehicles with route customization, geofencing, real-time retargeting, smart QR codes, proof-of-posting and attribution reporting. Tell us the goal and the window, and we will build the route and reporting around them. Start at beacon-ads.com, or see how we handle events and trade shows.

FAQ
What are the main types of OOH attribution models?
Credit-allocation models include first-touch, last-touch, linear, time-decay and position-based. Alongside them sit incrementality methods such as test versus control, brand lift, foot-traffic attribution and sales lift. Most OOH programs combine one of each.
What is the best attribution model for OOH?
No single model wins. A multi-touch view usually represents OOH better than last-touch, because billboards rarely get the final click. For proof of impact, a well-built test-versus-control study is the stronger evidence.
How do you measure OOH campaigns?
Compare an exposed group with a matched, unexposed control group and measure the difference in the outcome you care about, such as visits, site traffic or sales. Add exposure proof and a defined attribution window, and report the limits alongside the result.
How long should an OOH attribution window be?
The OAAA’s modeling guidance calls 30 days typical and 90 days common for automotive. Choose the window from your own sales cycle and set it before the campaign starts.
Sources
- OAAA: Out of Home Advertising measurement and analytics guide
- OAAA: Modeling Best Practices White Paper 2021
- OAAA: DOOH measuring success
- IAB: DOOH Measurement Guide, July 2025
- Broadsign: Out-of-home data capabilities, a marketer’s guide