Brand lift for out-of-home (OOH) is the measurable change in how people think about your brand, such as awareness, recall, consideration or purchase intent, that you can credibly tie to a billboard, transit or mobile campaign. You measure it by comparing people who were exposed to the campaign with a matched group who were not, usually through surveys. The rest of this guide covers what to measure, how to build the two groups, how to read the numbers, and how to keep QR scans and location data in their proper place.
TL;DR
- OOH brand lift is the difference in brand metrics (awareness, recall, consideration, intent) between an exposed group and a matched control group.
- The control group must be fully unexposed and similar to the exposed group in its likelihood to buy, visit or download. Use a pre-campaign baseline to check the match.
- In-person intercepts at a location or event are often the most useful survey method, because later phone or online surveys struggle to find people who were actually there.
- QR scans, web visits and foot traffic are attribution signals. They complement brand lift and never replace it.
- Plan the measurement before the campaign launches: define exposure, pick the outcome, set the attribution window.
Table of Contents
- What brand lift means for an out-of-home campaign
- Which brand outcomes you can track
- How researchers prove OOH caused the change
- Building exposed and control groups that hold up
- How the lift number is calculated and read
- Where QR scans and location data fit
- Limits and privacy: what U.S. advertisers should account for
- A pre-launch checklist for OOH brand lift
- Perspective: why mobile OOH suits lift measurement
- Plan a measurable campaign with us
- FAQ
- Sources
What brand lift means for an out-of-home campaign
Most of the pages that rank for this topic describe brand lift in the context of video and connected TV, where the platform can tag who saw an ad and who did not. The core idea is the same in OOH: brand lift is the quantifiable improvement in perception, awareness, interest or intent after advertising. The difference is how you know who was exposed.
A person walking past a billboard does not log in. So OOH brand lift always depends on a design decision: how will we define “exposed” and “not exposed” for this campaign? A static board on one highway, a transit shelter network, a wrapped rideshare fleet and an LED truck at a trade show each answer that question differently.
That is why brand lift is a study, not a button. The result is only as good as the groups behind it.
Which brand outcomes you can track
Pick the outcome that matches the job the campaign was bought to do. Measurement providers list a familiar set of OOH-relevant metrics: aided or unaided awareness, aided or unaided ad recall, favorability, consideration, purchase intent and brand perception. The Out of Home Advertising Association of America (OAAA) adds that brand loyalty, Net Promoter Score, usage lift, traffic lift and sales lift are also candidates, often reported next to brand equity measures.
A practical way to choose:
| Campaign goal | Primary brand metric | Typical question |
|---|---|---|
| Launch or entering a new market | Unaided and aided awareness | “Which brands in this category come to mind?” |
| Staying visible during a season or event | Ad recall | “Do you recall seeing advertising for this brand recently?” |
| Competing for a short list | Consideration | “Would you consider this brand next time?” |
| Driving a purchase or visit | Purchase intent, traffic lift | “How likely are you to visit or buy in the next month?” |
Choose one primary metric and one or two supporting ones. A study that tries to prove everything usually proves nothing, because every extra question adds noise and shrinks the sample you can analyze per metric.
How researchers prove OOH caused the change
The causal logic is simple. If two groups are alike in every way except exposure, any gap in their answers is the campaign’s effect.

The OAAA describes two common survey routes: exit-intercept surveys in test and control locations, or post-exposure telephone or online interviews with test and control groups. Each has trade-offs.
Intercept surveys
Interviewers approach people at or near the exposure point, or at an event, and ask the brand questions on the spot. The OAAA notes that in-person intercepts can confirm a person was at a place or event with potential exposure and are often the most useful for campaign feedback. You then run the same survey in a comparable control location where the campaign did not run.
Post-exposure phone or online surveys
These scale better and cost less per response, but the same OAAA guidance warns that later phone or online surveys are hard to run because it can be difficult to identify and contact people who were at a location. If you go this route, recruit using a location-based audience built from permissioned, anonymous data, and screen respondents carefully.
Matched markets
For city-level campaigns, you can run in a test market and hold a comparable market back as the control. This is the same logic behind geo lift testing, which measures incrementality at the market level and pairs well with a survey layer when you need to understand perception as well as response.
Building exposed and control groups that hold up
Most failed OOH lift studies fail at this step, not at the survey. Three rules from OAAA modeling guidance are worth writing into any study brief.
- The control group must be truly unexposed. The OAAA says the control group must consist entirely of people or households unexposed to the campaign and should match the test group on propensity to buy the brand, visit the store or download the app.
- Check the match with a baseline. The same paper advises using a pre-campaign period so you can confirm both groups show similar baseline behavior. If they already differed before the ads ran, the gap afterward proves little.
- Balance the data quality, too. When location data is part of the design, the groups must also be balanced on reporting frequency and precision, because infrequent or low-precision location data can skew conversion rates.
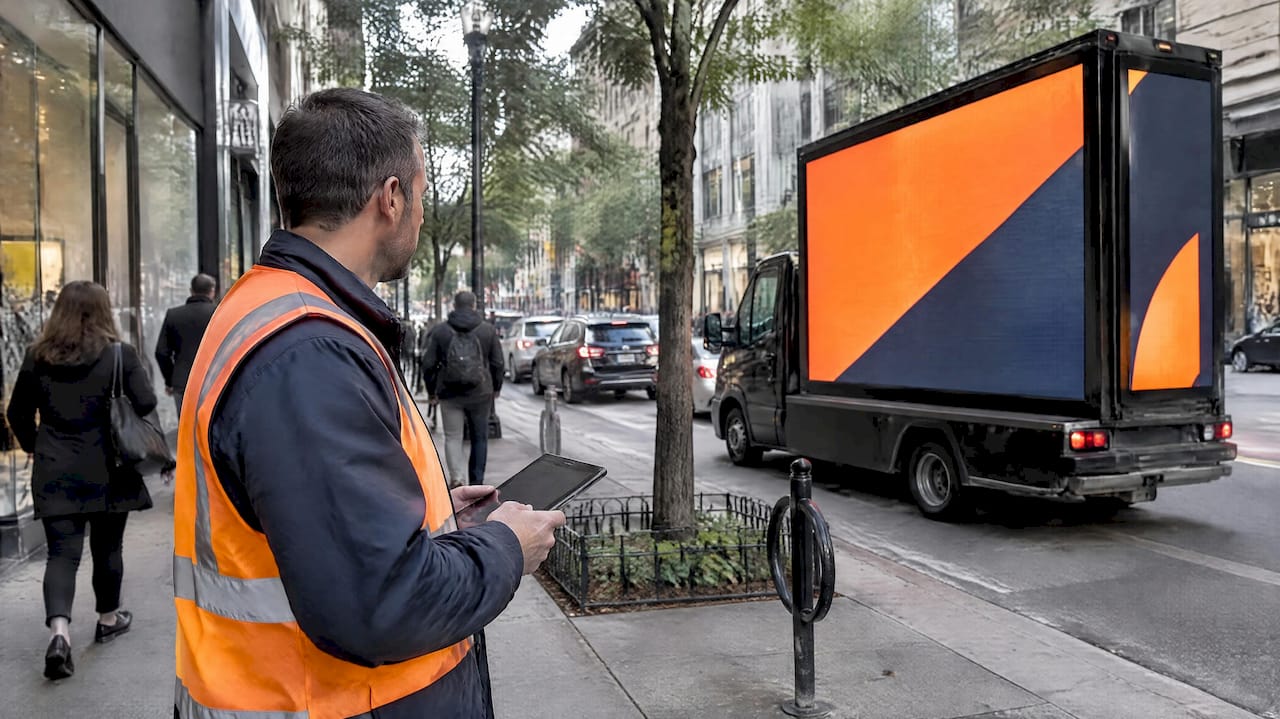
For a mobile campaign the exposure definition has a practical advantage. Routes are chosen in advance, so you know which neighborhoods, venues and time windows the vehicle covered. Proof-of-posting records with GPS and photos give you the actual path, not the planned one, which lets you define the exposed zone from evidence. If you want a deeper look at how route and location choices shape results, our guide to geolocation strategies for out-of-home walks through it.
How the lift number is calculated and read
The arithmetic is the easy part. For any metric:
- Absolute lift = exposed result minus control result (in percentage points).
- Relative lift = absolute lift divided by the control result.
A worked example with invented numbers, for illustration only: if 24% of exposed respondents name your brand unprompted and 20% of control respondents do, absolute lift is 4 points and relative lift is 20%. Report both. A 4-point gain on a small base can look dramatic as a percentage and modest as a share of the market.
What makes the number trustworthy is everything around it:
- Sample size. Each cell (exposed and control) needs enough completes that the difference is larger than random noise. Ask your research partner for the confidence interval or significance test behind every headline lift, not only the point estimate.
- Timing. The OAAA defines an attribution window as a defined period after a campaign ends in which a response can be tied to the campaign, accounting for advertising’s lingering effect. Decide the window before launch and apply it to both groups. For a deeper look at how to set one up across channels, see this walkthrough of multi-touch attribution setup.
- Representativeness. If your data does not cover the campaign geography, the OAAA says results should be projected, and if the data is not representative they should be weighted.
Where QR scans and location data fit
Smart QR codes, unique URLs and location visits are valuable. They are not brand lift.
The OAAA’s measurement guidance treats brand lift, online traffic, app downloads and social impact as separate metrics, and describes using unique URLs, language and keywords to track searches, hashtags and website visits. That separation is useful in practice:
| Signal | What it tells you | What it does not tell you |
|---|---|---|
| Brand lift survey | Whether perception or intent changed | How many people took action |
| QR scans, unique URLs | Who engaged right now, and a lead record | How many people noticed and remembered but did not scan |
| Location visits | Whether exposed people later visited a place | Why they went, or what they think of the brand |
| Sales or traffic lift | Business outcome | Which part came from awareness versus promotion |
The strongest reports line these up as a funnel. Brand lift shows the top (did they notice and remember us?), scans and visits show the middle, and sales or leads show the bottom. When the three move together, you have a story. When scans are high but lift is flat, the creative may drive curiosity without building the brand. When lift is strong but scans are low, the campaign may be doing its awareness job and the call to action needs work.
Our article on data-driven out-of-home strategies covers how to connect these layers in one reporting view.
Limits and privacy: what U.S. advertisers should account for
Good measurement states its limits openly.
Other marketing can leak into the result. The OAAA warns that OOH attribution may misattribute effects from other media or marketing factors, such as trade and consumer promotions, if test and control groups are not equally exposed to them. If a retailer runs a sale in your test city only, the lift belongs to the sale as much as to the ads.
Overlapping media is hard to separate. The OAAA’s attribution glossary names collinearity as a major modeling challenge when OOH runs alongside other media, and points to test-and-learn experiments as the way to tease out individual contributions. In practice: stagger launches where you can, and keep a clean market or period for comparison.
Data quality and consent. The OAAA’s measurement guide says advertisers should assess accuracy, scale, coverage, precision, representativeness and bias, that data use should be permissioned, and that anonymous, aggregated audiences suit planning and evaluating OOH. Ask every vendor, including us, how location audiences are built and whether they are aggregated and anonymous. If your campaign collects leads through QR codes, have your legal team review the data-capture language and privacy notice before launch.

Confounders you can control. For a broader look at the biases that distort impact readings, this marketing strategy resource is a helpful companion to your planning process.
A pre-launch checklist for OOH brand lift
- Write the single question the study must answer, and choose one primary metric.
- Define exposure: which routes, venues, zones and dates count as exposed.
- Choose the control: a matched market, a matched location, or a matched audience, and confirm it will not see the campaign.
- Take a baseline before launch, in both groups.
- List other marketing running in either group during the flight (promotions, other media) and keep it balanced.
- Set the attribution window and the survey timing.
- Agree the significance threshold and how results will be reported (absolute and relative lift, with confidence intervals).
- Add unique QR codes or URLs so engagement can be read next to lift, and label each as a separate metric.
Perspective: why mobile OOH suits lift measurement
We build campaigns for marketers who have to show what the money did, so we think about measurement before we think about creative.
Fixed boards give you a location and an audience estimate. A mobile campaign gives you something more useful for a lift study: control over where the message goes and when. You choose the routes, the neighborhoods, the venues and the event windows. That lets you create a clean exposed zone and keep a comparable zone untouched, which is exactly what a brand lift design needs.
Proof-of-posting with GPS and photo tracking records where the vehicle actually went. Geofencing and audience filtering let you tie the exposed zone to the people you want to reach. Smart QR codes capture engagement and leads in the moment, so your report can show the awareness story and the response story side by side.
Our view is that brand lift and attribution are partners. Run the survey to learn whether people noticed and remembered you. Read the scans, visits and leads to learn what they did next. Plan both before launch, and the campaign report stops being a debate and becomes a decision.
Scott
Plan a measurable campaign with us
If you are planning a campaign where you need to show lift as well as reach, we can help you design the routes, exposure zones and reporting around it. Beacon Mobile Media runs LED mobile billboards and wrapped rideshare vehicles across all 50 states, with geofencing, real-time retargeting, smart QR codes, proof-of-posting and attribution analytics built in.

Event marketers can see how this works in practice in our guide to targeting conferences and trade shows with LED mobile billboards, where intercept surveys are especially practical because attendees are in one place. If you would rather test the water first, read how to prove mobile billboard effectiveness in two weeks.
FAQ
What is a good brand lift for an OOH campaign?
There is no universal benchmark worth trusting, because lift depends on the category, the starting level of awareness, the creative and the size of the exposed audience. A brand with low starting awareness can show bigger gains than a household name. Judge your result against your own baseline and your stated goal, and report it with its confidence interval.
How long after a campaign should I survey?
Set the timing before launch and apply it to both groups. The OAAA describes an attribution window as a defined period after the campaign ends, which accounts for the lingering effect of advertising. Intercept surveys can run during the flight, while follow-up surveys run inside the window you chose.
Can QR code scans prove brand lift?
No. Scans measure engagement from people who chose to act, while brand lift measures a change in perception across the exposed audience, including people who never scanned. Use scans as a complementary signal and report them as a separate metric.
Do I need a control group for OOH?
Yes, if you want to claim the campaign caused the change. Without an unexposed, matched group, you cannot separate the campaign’s effect from seasonality, promotions or other media. The control can be a matched market, a matched location or a matched audience.
Is OOH brand lift measurement private?
It can be, when it is designed that way. The OAAA says data use should be permissioned and that anonymous, aggregated audiences are suitable for planning and evaluating OOH. Ask vendors how audiences are built, and have counsel review any lead-capture language.
Sources
- Brand Lift Solutions, On Device
- OAAA, DOOH: Measuring Success
- OAAA, Modeling Best Practices White Paper 2021
- OAAA, MMM Attribution Glossary 2021
- OAAA, OOH Measurement and Analytics Guide
- Multi-Touch Attribution Setup, Quick To Impress
- Marketing & Strategy, Charles Choate Creative