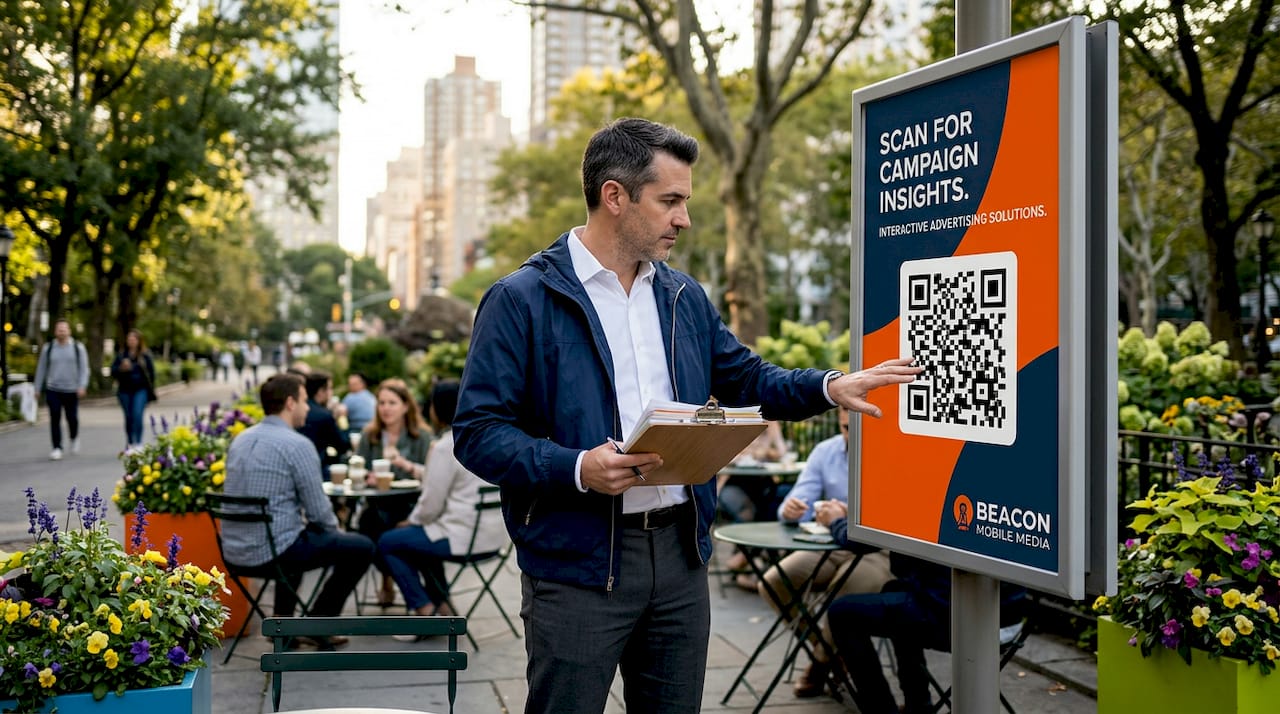
A repeatable localized marketing strategy workflow runs in six stages: segment and prioritize markets, gather local insights and compliance requirements, adapt messaging and creative, activate cross-channel delivery with automation, govern approvals and translations, then measure and iterate by locale. Following this six-step blueprint keeps campaigns consistent at the brand level while staying genuinely relevant at the market level.
Workflow at a glance:
- Segment and prioritize: Score markets by revenue potential, compliance risk, and operational readiness
- Research: Pull first-party CRM data by ZIP, local search trends, social listening, and in-market events
- Adapt: Localize headlines, imagery, offers, and CTAs using an invariants-vs-adaptables framework
- Activate: Deploy cross-channel with tagged UTMs, geo-fencing, and automation triggers
- Govern: Route assets through a tiered approval flow with SLA targets and version control
- Measure: Track locale-specific KPIs and run bi-weekly experiments to iterate
Core success metrics to track from day one:
- Locale CTR uplift vs. national baseline
- Visit-to-lead conversion rate by market
- Proof-of-posting completion rate (for OOH placements)
- Local customer lifetime value (LTV) by region
- Cost-per-acquisition by locale
Three anchoring technologies make this workflow measurable: a customer data platform (CDP) for first-party signal aggregation, geo-fencing for physical-to-digital audience capture, and attribution pixels that stitch QR scan events to downstream conversions.
Key Takeaways
A localized marketing strategy workflow succeeds when market prioritization, creative governance, and attribution are designed as a single connected system, not three separate workstreams.
| Point | Details |
|---|---|
| Start with a readiness audit | Map data sources, asset quality, and approval workflows before activating any automation. |
| Score markets before committing budget | Use a weighted matrix (revenue, compliance, readiness) to assign localization depth and pilot sequence. |
| Lock invariants, open adaptables | Pre-approve a swap library of imagery and headline variants to cut approval time without weakening governance. |
| Attribution requires proof-of-posting | GPS/photo confirmation plus QR scan events in a CDP are the minimum to connect OOH impressions to digital conversions. |
| Beacon-ads for integrated OOH + digital | Beacon Mobile Media combines LED mobile billboards, smart QR capture, and attribution reporting across all 50 states. |
Table of Contents
- Your at-a-glance workflow checklist
- How the detailed localized marketing workflow runs end-to-end
- How to prioritize regions and markets for rollout
- What local research and compliance actually require
- How to adapt messaging, visuals, and offers per locale
- How to plan media, pick channels, and scale with automation
- How to run approvals, translations, and brand governance without slowing down
- How to measure, attribute, and iterate by locale
- Case study: how Beacon Mobile Media runs integrated local campaigns
- Practical perspective: what actually goes wrong in U.S. localized campaigns
- How Beacon Mobile Media helps you execute localized OOH campaigns
- Sources
Your at-a-glance workflow checklist
Use this as a project manager’s reference. Each stage has a suggested timeline and a recommended owner.
Stage-by-stage checklist:
- Stage 1: Prioritization and readiness audit (Weeks 1–2) — Owner: Global program lead. Deliverable: scored market list and go/no-go decision for pilot markets.
- Stage 2: Local research and compliance (Weeks 2–4) — Owner: Local market manager + legal reviewer. Deliverable: risk register, channel map, and cultural brief.
- Stage 3: Creative adaptation for pilot (Weeks 3–6) — Owner: Creative transcreator + local reviewer. Deliverable: localized asset set with approval sign-off.
- Stage 4: Activation and tagging setup (Weeks 5–7) — Owner: Paid media manager + analytics owner. Deliverable: live campaigns with UTM/QR parameters and CDP events firing.
- Stage 5: Approval governance and proof-of-posting (Ongoing) — Owner: Brand governance lead + local market manager. Deliverable: completed proof-of-posting log and version-controlled asset library.
- Stage 6: Measurement and iteration (Weeks 7+ / ongoing) — Owner: Analytics owner. Deliverable: locale dashboard, weekly signal checks, bi-weekly experiment results.
Go/no-go signals before launching a pilot:
- At least one local market manager is embedded and available for review cycles
- First-party data (CRM or CDP) is mapped and accessible for the target locale
- Creative assets have cleared legal and cultural review
- Tagging infrastructure (UTMs, QR parameters, attribution pixels) is tested and firing
- Proof-of-posting documentation process is confirmed with the OOH vendor
Pilot thresholds: A market qualifies for pilot when it scores above the midpoint on your prioritization matrix (see Section 4) and has at least one owned data source (email list, loyalty program, or CRM segment) for that geography.
How the detailed localized marketing workflow runs end-to-end
This is the operational playbook. Each step has a defined output, a role, and a service-level agreement (SLA) so nothing stalls in a handoff.
Step 1: Define objectives and success criteria
Output: Campaign brief with SMART goals per locale, budget allocation, and KPI targets.
Owner: Global program lead.
SLA: Complete before any creative or media work begins.
Start with the question every local campaign eventually has to answer: what does success look like in this market, not the national average? Set locale-specific targets for reach, CTR, cost-per-acquisition, and LTV. Budget allocation should follow your prioritization score (see Section 4) rather than equal splits across markets.
Step 2: Segment and prioritize local audiences
Output: Ranked market list with localization depth assigned (light, deep, or market-native).
Owner: Global program lead + analytics owner.
SLA: 3–5 business days.
Aggregate first-party signals into a CDP, then segment by ZIP-level purchase behavior, loyalty tier, and engagement recency. Pair that with local search trend data and social listening to identify where demand already exists. Markets with strong existing demand and manageable compliance risk are your fastest pilots.
Step 3: Gather local insights and compliance requirements
Output: Local research brief, risk register, and channel feasibility map.
Owner: Local market manager + legal reviewer.
SLA: 5–10 business days.
Pull signals from multiple sources: first-party CRM by ZIP, Google Trends for local search volume, social listening tools for sentiment and local conversation topics, in-market partner data, and the local events calendar. Localization extends well beyond translation to include visual norms, currency and unit formats, local platform preferences, and regulatory constraints. Document every compliance requirement in a risk register with a named owner and a resolution deadline.
Step 4: Adapt messaging, visuals, and offers
Output: Localized asset set (copy, imagery, CTAs, offer terms) with approval sign-off.
Owner: Creative transcreator + local market manager.
SLA: 7–14 business days for pilot creative.
Use the invariants-vs-adaptables architecture: lock brand fonts, logo placement, and core value proposition at the template level, then open local modules for headline copy, imagery, offer details, and CTA language. A creative brief template for local teams should include: campaign objective, invariant brand elements (list them explicitly), approved local adaptations, cultural review questions, and the name of the local reviewer who must sign off before production.
Creative brief template (minimum fields):
- Campaign name and locale
- Core message (invariant, do not change)
- Approved headline variants (list 2–3 options)
- Imagery guidance (approved and prohibited visual themes)
- Offer details and local pricing/units
- CTA copy options
- Local reviewer name and sign-off deadline
Step 5: Localized media planning and channel selection
Output: Channel plan by locale with budget split, flight dates, and tagging spec.
Owner: Paid media manager + local market manager.
SLA: 5–7 business days.
Channel choice follows market type. Urban event markets favor high-visibility OOH (mobile billboards, wrapped rideshare vehicles) combined with geo-fenced digital retargeting. Suburban markets often respond better to a mix of search, social, and direct mail. Non-Google-dominant ecosystems require platform-specific creative and bidding strategies. Geolocation, device, referral source, and time-of-day signals all inform which channel and which message a given audience segment sees.
Step 6: Activate cross-channel delivery and scale via automation
Output: Live campaigns with CDP events firing, QR parameters active, and automation triggers confirmed.
Owner: Paid media manager + analytics owner.
SLA: 2–3 business days post-creative approval.
Tag every asset with UTM parameters that include locale, channel, and campaign identifiers. Smart QR codes on physical placements should pass scan events directly into your CDP for retargeting. Automation recipes reduce manual launch effort: a geo-trigger fires a localized social ad when a user enters a defined radius; a QR scan event triggers an SMS follow-up within 24 hours; a proof-of-posting confirmation triggers a digital retargeting window. Practitioners consistently recommend linking mobile billboard placements to digital retargeting and QR-driven lead capture to close the loop between physical exposure and online conversion.
Step 7: Govern approvals, translations, and brand guardrails
Output: Approved asset library with version control and proof-of-posting log.
Owner: Brand governance lead.
SLA: See approval flow in Section 8.
Step 8: Measure, attribute, and iterate
Output: Locale dashboard with weekly signal checks and bi-weekly experiment results.
Owner: Analytics owner.
SLA: Dashboard live within 48 hours of campaign launch.
Process area comparison: manual vs. automated approaches
| Process Area | Manual Approach | Automated Approach |
|---|---|---|
| Keyword and trend research | Analyst pulls weekly reports | CDP + search API feeds daily signals |
| Ad copy localization | Transcreator drafts per locale | AI draft (~70%) + human edit (~30%) |
| Reporting and dashboards | Analyst compiles weekly | Auto-generated locale dashboards |
| Approval routing | Email chains with manual tracking | Workflow tool with SLA alerts |
| Proof-of-posting collection | Field team emails photos | GPS/photo submission via mobile app |

The ~70% AI draft / 30% human edit split for copy generation at scale is a practical production benchmark, but it requires a readiness audit first. Scattered data and inconsistent assets are the most common reasons localization automation fails before it starts.
Sample KPIs by step:
- Steps 1–2: Market readiness score, data coverage by locale
- Steps 3–4: Creative approval cycle time, cultural review pass rate
- Steps 5–6: Impression share by locale, QR scan rate, geo-fence entry rate
- Steps 7–8: Proof-of-posting completion rate, locale CTR uplift, visit-to-lead rate, cost-per-acquisition
How to prioritize regions and markets for rollout
Not every market deserves the same investment at launch. A scoring matrix keeps the decision objective.
Prioritization scoring matrix:
Score each candidate market out of 10 per dimension, apply weights, and rank. Markets scoring above 7.0 overall are strong pilot candidates. Markets scoring 5.0–6.9 are candidates for light localization. Markets below 5.0 need more groundwork before activation.
Localization depth decision guide:
- Light localization (score 5.0–6.9): Translate copy, adapt currency and date formats, swap one or two images. Minimal governance overhead.
- Deep localization (score 7.0–8.4): Full creative transcreation, local offer terms, platform-specific creative, embedded local reviewer in approval loop.
- Market-native (score 8.5+): Dedicated local team, market-specific campaign strategy, separate brand governance track, local compliance counsel.
Choosing localization depth based on demand, channel constraints, compliance, and trust requirements is the operational logic behind this matrix. Each depth level carries different resource and governance costs, so the scoring keeps those trade-offs explicit rather than defaulting to “go deep everywhere.”
The core trade-off: rapid rollout across many markets with light localization generates faster learning but risks lower relevance and higher creative rejection rates. Deep localization in fewer markets generates stronger performance signals but takes longer to scale. For most U.S. teams, starting with two to three high-scoring markets and running a 6–8 week pilot before expanding is the lower-risk path.
What local research and compliance actually require
Local insight gathering is where most teams underinvest, and it shows up later as creative that misses the mark or campaigns that get pulled for compliance reasons.
High-value local data sources:
- First-party CRM segmented by ZIP code or DMA
- Google Trends and local search volume data for keyword demand signals
- Social listening tools (monitoring local hashtags, community groups, and regional news)
- In-market partner data (co-op programs, local retailer sell-through data)
- Local events calendar (festivals, sports seasons, trade shows) for timing and contextual relevance.
- Foot traffic data from geo-fence reports and mobile location providers
Risk register template (minimum fields per risk):
- Risk description (e.g., “Sweepstakes promotion requires state-specific disclosures in NY and FL”)
- Risk category (legal, cultural, operational)
- Likelihood (high/medium/low)
- Impact if triggered (high/medium/low)
- Owner (named individual, not a team)
- Resolution action and deadline
- Status (open/resolved)
Cultural sensitivity checklist:
- Are imagery choices appropriate for the local demographic and cultural context?
- Do color choices carry unintended meaning in this market?
- Are humor, idioms, or references locally understood?
- Have local reviewers (not just translators) signed off on tone?
- Are promotion terms compliant with state-specific advertising rules?
Pro Tip: *Before finalizing any local creative, run a five-question validation with a local reviewer: Does this feel like it was made for us? Is anything confusing or off-putting? Does the offer make sense given local pricing norms? Is the CTA clear? Would you share this?
How to adapt messaging, visuals, and offers per locale
The invariants-vs-adaptables framework is the cleanest way to manage brand consistency without strangling local relevance. Lock the elements that define your brand at the template level. Open the elements that drive local resonance for local teams to edit.
Invariants (never change):
- Brand logo, color palette, and typography
- Core value proposition and brand voice tone
- Legal disclaimers and trademark language
- Safety and compliance copy
Adaptables (local teams can edit within guidelines):
- Headline copy and subheadlines
- Hero imagery and supporting visuals
- Offer details, pricing, and promotional terms
- CTA language and button copy
- Local proof points (testimonials, local landmarks, regional references)
- Platform-specific creative dimensions and formats
Localization checklist for each asset:
- Core message preserved and not altered
- Headline adapted for local tone and idiom
- Imagery reviewed for cultural appropriateness
- Offer terms reflect local pricing and units (not just currency swap)
- CTA copy tested for local conversion language
- Date and phone number formats match local convention
- Local reviewer has signed off
- Asset version logged in the governance system
A/B test ideas for local creative validation:
- Tone: formal vs. conversational headline in the same locale
- Imagery: local landmark or community reference vs. generic lifestyle photo
- Local proof points: regional customer reference vs. national brand claim
- CTA language: “Get a quote” vs. “Talk to a local rep” vs. “See it in your neighborhood”
- Offer framing: percentage discount vs. dollar-amount savings vs. free trial
Adapting visuals, local platforms, date and phone formats, and channel choices alongside copy is what separates localization from translation. A campaign that swaps language but keeps a stock photo from the wrong region still reads as generic.
How to plan media, pick channels, and scale with automation
Channel selection is a market-type decision, not a preference. The same brand running campaigns in Chicago’s River North and rural Nebraska needs a fundamentally different channel mix.
Channel decision framework by market type:
- Urban event markets: LED mobile billboards and wrapped rideshare vehicles for high-visibility reach, geo-fenced digital retargeting for follow-up, social ads for engagement. Localized advertising tactics that drive foot traffic in dense urban environments rely on physical presence combined with digital capture.
- Suburban markets: Search (Google Local Services Ads, local search campaigns), social (Facebook/Instagram with ZIP-level targeting), direct mail for high-LTV segments.
- Non-Google-dominant ecosystems: Platform-specific creative for Bing, Apple Maps, Waze, and local directory listings; SMS for high-opt-in audiences.
Tagging standards (apply to every asset):
- UTM structure:
utm_source/utm_medium/utm_campaign/utm_content/utm_term— include locale code inutm_campaign(e.g.,spring26_chicago_il) - QR parameters: encode locale, placement ID, and campaign date into every QR URL so scan events are attributable to a specific physical placement
- Google Business Profile (GBP) metadata: include service area, category tags, and UTM-tagged post URLs
- CDP event naming: standardize event names across channels so locale-level attribution rolls up cleanly
Automation recipes:
- Geo-trigger: User enters geo-fence radius around a mobile billboard route → fires a localized social or display ad within 2 hours
- QR scan follow-up: User scans QR on physical placement → CDP receives scan event → SMS or email follow-up sent within 24 hours
- GBP post automation: New local inventory or event confirmed → auto-publish GBP post with localized copy and UTM link
- Proof-of-posting trigger: Field team submits GPS/photo confirmation → analytics owner receives alert → retargeting window activates
SLA targets for automated vs. human-reviewed publishing:
- Low-risk, inventory-based updates (GBP hours, pricing): auto-publish, no review required
- Localized ad copy (non-sensitive): AI draft → human review within 4 business hours → auto-publish on approval
- Community-facing or sensitive creative: human review required, 24-hour SLA, no auto-publish
A 4-hour review SLA should trigger an escalation alert at 3 hours 12 minutes. Most approval delays happen because reviewers don’t know something is waiting.*
Personalizing channel choice and timing using geolocation, device, referral source, and buyer status signals is what separates a localized campaign from a nationally targeted one with a ZIP code filter bolted on.

How to run approvals, translations, and brand governance without slowing down
Speed and control are genuinely in tension in localized campaigns. The solution is not to choose one. It is to design the approval flow so that low-risk content moves fast and high-risk content gets the scrutiny it needs.
Recommended approval flow:
- Creative transcreator submits localized asset to workflow tool, tags locale and risk level (low/medium/high)
- Local market manager reviews for cultural accuracy and local relevance (SLA: 4 hours for low, 8 hours for medium/high)
- Legal/compliance reviewer reviews for regulatory compliance (SLA: 8 hours for medium, 24 hours for high risk)
- Brand governance lead gives final sign-off on any asset flagged as high-risk or market-native (SLA: 24 hours)
- Auto-publish triggers on approval; version and timestamp logged in asset library
Governance patterns that work at scale:
- Central templates with locked invariants and editable local modules (see Section 6)
- Version control: every asset gets a version number, locale tag, and approval timestamp
- Propagation rules: when global messaging changes, a workflow alert fires to all active locale teams with a 5-business-day window to update local variants
- Rollback protocol: if a live asset is flagged post-launch, the governance lead can pull it and revert to the prior approved version within 2 hours
Proof-of-posting checklist (OOH placements):
- GPS coordinates of placement location at time of posting
- Timestamped photo of the physical placement (billboard, vehicle wrap, or screen)
- Asset version number and campaign ID visible or logged
- Route ID or placement ID matched to the media plan
- Field team member name and submission timestamp
- Analytics owner confirmation that retargeting window has been activated
This checklist closes the loop between physical placement and digital attribution. Without it, OOH spend is essentially unverifiable.
How to measure, attribute, and iterate by locale
Attribution is where localized campaigns either prove their value or get cut. The measurement model has to handle both offline OOH exposure and digital conversion events.
KPI list by funnel stage:
| Stage | KPI | Owner |
|---|---|---|
| Reach | Impressions by locale, geo-fence entries | Analytics owner |
| Engagement | QR scan rate, local CTR, GBP click-through | Paid media manager |
| Conversion | Visit-to-lead rate, cost-per-acquisition | Analytics owner |
| Retention | Local LTV, repeat purchase rate by locale | CRM owner |
| Proof | Proof-of-posting completion rate | Brand governance lead |
Attribution recipe for OOH + digital:
- Mobile billboard or wrapped vehicle runs a defined route with GPS tracking active
- Smart QR code on the placement captures scan events with locale and placement ID
- Scan events fire into the CDP, creating an audience segment of exposed users
- Digital retargeting campaigns serve ads to that segment within a defined window (typically 7–14 days)
- Conversion events (form fills, purchases, calls) are matched back to the exposed segment
- Proof-of-posting GPS/photo confirms the physical placement ran as planned
This recipe links physical exposure to online outcomes without relying on self-reported attribution. Integrating OOH with digital retargeting and QR capture gives you a measurable funnel from billboard impression to lead.
Sample dashboard metrics and iteration cadence:
- Weekly signal checks: Impression volume by locale, QR scan rate, CTR vs. baseline, proof-of-posting completion rate
- Bi-weekly local experiments: One A/B test per active locale (creative, offer, or CTA variant); read results at statistical significance before scaling the winner
- Monthly rollups: Cost-per-acquisition by locale, local LTV trend, channel mix efficiency, governance SLA compliance rate
Collecting first-party data into a CDP and using behavioral segments to drive personalized follow-up channels is what makes the measurement loop self-reinforcing. Each campaign cycle adds more signal to the CDP, which improves the next round of targeting.
Case study: how Beacon Mobile Media runs integrated local campaigns
Here is how an integrated local campaign runs end-to-end using Beacon Mobile Media’s platform, from market selection through measurement.
Campaign objective: Drive foot traffic and lead capture for a retail brand launching in three new U.S. metro markets.
Step-by-step execution:
- Market selection: Score candidate metros using the prioritization matrix. Select markets with high foot traffic density, existing first-party CRM coverage, and OOH permit availability.
- Route planning: Beacon Mobile Media customizes LED mobile billboard routes to cover high-traffic corridors, event venues, and competitor proximity zones in each metro. Routes are GPS-tracked in real time.
- Asset deployment: Wrapped rideshare vehicles (Uber and Lyft) run localized creative in each market simultaneously, extending reach into residential and transit corridors that fixed billboards miss.
- QR data capture: Every physical placement carries a smart QR code encoded with locale, placement ID, and campaign date. Scans fire directly into the CDP, building an exposed-audience segment for retargeting.
- Digital retargeting activation: Within hours of a QR scan or geo-fence entry, a localized digital ad serves to the exposed user across social and display channels. The retargeting window is set to 14 days.
- Proof-of-posting documentation: Field teams submit GPS coordinates, timestamped photos, and asset version numbers through a mobile submission tool. The analytics owner receives confirmation and activates the retargeting window.
Measurement structure:
- GPS route logs confirm physical placement ran as planned (proof-of-posting)
- QR scan events in the CDP identify exposed users by locale and placement
- Digital retargeting conversion events (form fills, calls, purchases) are matched to the exposed segment
- Weekly dashboard shows QR scan rate, retargeting CTR, and visit-to-lead rate by metro
Linking a mobile billboard route to a smart QR code and a retargeting pixel turns a physical impression into a trackable, attributable lead. The proof-of-posting log closes the accountability gap that makes most OOH spend hard to defend in a budget review.
What metrics were tracked and how they informed iteration:
- QR scan rate by placement location identified which routes and time slots drove the most engagement
- Retargeting CTR by locale revealed which creative variants resonated in each market
- Visit-to-lead rate confirmed whether digital follow-up was converting exposed audiences
- Proof-of-posting completion rate tracked operational execution quality
Results from each metro fed directly into the next week’s route adjustments and creative rotation decisions. Markets with lower QR scan rates got route changes; markets with lower retargeting CTR got creative variants tested in the bi-weekly experiment cycle.
Practical perspective: what actually goes wrong in U.S. localized campaigns
The workflow above is sound. What breaks it is almost never the strategy. It is the operational gaps that teams discover after launch.
Pro tips from running U.S. localized campaigns:
Pro Tip: Embed a local market manager in every approval loop from day one. Remote reviewers who only see assets at the final stage catch problems too late to fix without blowing the SLA.
Pro Tip: Prioritize first-party data integration before you build any automation. A CDP with clean, ZIP-level segments is worth more than any automation recipe built on top of fragmented data.
Pro Tip: Run event-triggered automation for your highest-volume, lowest-risk updates. Save human review cycles for community-facing creative and anything that touches a sensitive local topic.
Pro Tip: Set a single named owner for proof-of-posting collection in each market. Shared ownership means no one checks, and you end up with gaps in your attribution record exactly when a budget reviewer asks for them.
Common mistakes and short fixes:
- Over-localization: Adapting so many elements that the brand becomes unrecognizable. Fix: lock invariants explicitly in the creative brief and enforce them in the governance tool.
- Unclear ownership: Multiple people think they own the same approval step. Fix: one named owner per step, documented in the workflow tool, not in a shared doc.
- Poor measurement design: Setting up campaigns before tagging infrastructure is confirmed. Fix: run a tagging QA check 48 hours before launch, not on launch day.
- Skipping the readiness audit: Automating before data sources are mapped and asset quality is confirmed. Fix: run the readiness audit first — it takes a week and prevents months of rework.
One non-obvious shortcut that reduces approval friction without hurting governance: pre-approve a library of 10–15 “safe swap” imagery options and 5–7 headline variants for each locale at the start of the campaign. Local teams can mix and match from the pre-approved library without triggering a full review cycle. Only net-new creative goes through the full approval flow.
BCG’s personalization framework frames the goal as delivering the right experience on the right channel at the right time. That requires integrated data, always-on intelligence, and operational processes that don’t bottleneck on manual review. The pre-approved library is one of the simplest ways to operationalize that principle without building a custom workflow tool.
How Beacon Mobile Media helps you execute localized OOH campaigns
Running a localized campaign that combines physical presence with digital attribution is operationally complex. Beacon Mobile Media handles the OOH execution layer so your team can focus on strategy and measurement.

Beacon Mobile Media operates LED mobile billboard trucks and wrapped rideshare vehicles (Uber and Lyft) across all 50 states, with route customization down to specific corridors, event venues, and competitor proximity zones. Every placement includes GPS tracking, timestamped proof-of-posting documentation, and smart QR codes that feed scan events directly into your CDP for retargeting. Attribution reporting connects physical impressions to digital conversions, giving you a defensible measurement record for every market you activate.
For teams evaluating OOH vendors, the criteria that matter most are: geographic coverage, data integration depth (can scan events reach your CDP in real time?), proof-of-posting rigor, and reporting cadence. Beacon Mobile Media’s platform is built around all four. To see how data-driven OOH campaigns work in practice, or to get a quote for your next localized activation, visit Beacon-ads.
Sources
- Local marketing guide — Search Engine Land
- Localized marketing: How to build a localized marketing strategy – ActiveCampaign
- AI-driven local marketing strategy guide for enterprise – Nimblo
- Localized Marketing: Definition & How to Build an Effective Strategy – Weglot
- Personalization guide | Salesforce